4 sec in total
159 ms
3.6 sec
198 ms
Click here to check amazing Flood Map content for India. Otherwise, check out these important facts you probably never knew about floodmap.net
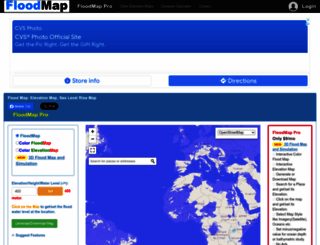
Flood Map shows the map of the area which could get flooded if the water level rises to a particular elevation. Sea level rise map. Bathymetric map, ocean depth. Effect of Global Warming and Climate C...
Visit floodmap.netWe analyzed Floodmap.net page load time and found that the first response time was 159 ms and then it took 3.8 sec to load all DOM resources and completely render a web page. This is a poor result, as 60% of websites can load faster.
floodmap.net performance score
name
value
score
weighting
Value3.4 s
37/100
10%
Value4.8 s
31/100
25%
Value9.7 s
11/100
10%
Value1,690 ms
11/100
30%
Value0
100/100
15%
Value18.4 s
3/100
10%
159 ms
103 ms
52 ms
33 ms
38 ms
Our browser made a total of 100 requests to load all elements on the main page. We found that 25% of them (25 requests) were addressed to the original Floodmap.net, 31% (31 requests) were made to Maps.google.com and 11% (11 requests) were made to Maps.gstatic.com. The less responsive or slowest element that took the longest time to load (2.2 sec) belongs to the original domain Floodmap.net.
Page size can be reduced by 444.7 kB (40%)
1.1 MB
678.0 kB
In fact, the total size of Floodmap.net main page is 1.1 MB. This result falls beyond the top 1M of websites and identifies a large and not optimized web page that may take ages to load. 65% of websites need less resources to load. Javascripts take 634.9 kB which makes up the majority of the site volume.
Potential reduce by 67.4 kB
HTML content can be minified and compressed by a website’s server. The most efficient way is to compress content using GZIP which reduces data amount travelling through the network between server and browser. HTML code on this page is well minified. It is highly recommended that content of this web page should be compressed using GZIP, as it can save up to 67.4 kB or 84% of the original size.
Potential reduce by 5.2 kB
Image size optimization can help to speed up a website loading time. The chart above shows the difference between the size before and after optimization. Flood Map images are well optimized though.
Potential reduce by 368.7 kB
It’s better to minify JavaScript in order to improve website performance. The diagram shows the current total size of all JavaScript files against the prospective JavaScript size after its minification and compression. It is highly recommended that all JavaScript files should be compressed and minified as it can save up to 368.7 kB or 58% of the original size.
Potential reduce by 3.5 kB
CSS files minification is very important to reduce a web page rendering time. The faster CSS files can load, the earlier a page can be rendered. Floodmap.net needs all CSS files to be minified and compressed as it can save up to 3.5 kB or 75% of the original size.
Number of requests can be reduced by 41 (44%)
93
52
The browser has sent 93 CSS, Javascripts, AJAX and image requests in order to completely render the main page of Flood Map. We recommend that multiple CSS and JavaScript files should be merged into one by each type, as it can help reduce assets requests from 31 to 1 for JavaScripts and from 4 to 1 for CSS and as a result speed up the page load time.
floodmap.net
159 ms
floodmap.css
103 ms
default.css
52 ms
jquery.min.js
33 ms
js
38 ms
polygon.js
92 ms
showcities.js
96 ms
default.css
155 ms
common.js
25 ms
map.js
37 ms
ga.js
37 ms
bg.gif
55 ms
tweet_button.html
134 ms
header.gif
54 ms
bgul.gif
45 ms
plusone.js
96 ms
like.php
74 ms
__utm.gif
14 ms
vpc6VNjRPXV.js
495 ms
LVx-xkvaJ0b.png
555 ms
cb=gapi.loaded_0
18 ms
cb=gapi.loaded_1
44 ms
fastbutton
144 ms
jot
118 ms
jot
116 ms
postmessageRelay
36 ms
api.js
46 ms
core:rpc:shindig.random:shindig.sha1.js
138 ms
2536007149-postmessagerelay.js
109 ms
rs=AGLTcCNqicBbTRy2Ny4TeyhsrBuZucE7Kg
13 ms
cb=gapi.loaded_0
57 ms
cb=gapi.loaded_1
54 ms
W5F8_SL0XFawnjxHGsZjJA.ttf
81 ms
util.js
44 ms
geocoder.js
44 ms
onion.js
24 ms
openhand_8_8.cur
41 ms
marker.js
12 ms
geometry.js
11 ms
poly.js
32 ms
ViewportInfoService.GetViewportInfo
31 ms
stats.js
29 ms
controls.js
27 ms
AuthenticationService.Authenticate
138 ms
GeocodeService.Search
94 ms
transparent.png
31 ms
css
65 ms
undo_poly.png
37 ms
google4.png
37 ms
mapcnt6.png
38 ms
sv5.png
37 ms
spotlight-poi.png
38 ms
vt
24 ms
vt
21 ms
vt
20 ms
vt
20 ms
vt
22 ms
vt
30 ms
vt
26 ms
vt
33 ms
vt
33 ms
vt
24 ms
vt
33 ms
vt
33 ms
vt
34 ms
vt
38 ms
vt
38 ms
vt
36 ms
vt
38 ms
vt
39 ms
vt
54 ms
infowindow.js
27 ms
tmapctrl.png
32 ms
cb_scout5.png
46 ms
tmapctrl4.png
28 ms
imgs8.png
35 ms
zN7GBFwfMP4uA6AR0HCoLQ.ttf
28 ms
RxZJdnzeo3R5zSexge8UUaCWcynf_cDxXwCLxiixG1c.ttf
34 ms
Hgo13k-tfSpn0qi1SFdUfaCWcynf_cDxXwCLxiixG1c.ttf
46 ms
d-6IYplOFocCacKzxwXSOKCWcynf_cDxXwCLxiixG1c.ttf
48 ms
elevation.js
15 ms
ElevationService.GetElevationForLine
22 ms
getTile.aspx
64 ms
getTile.aspx
1114 ms
getTile.aspx
1621 ms
getTile.aspx
102 ms
getTile.aspx
2207 ms
getTile.aspx
666 ms
getTile.aspx
1154 ms
getTile.aspx
179 ms
getTile.aspx
257 ms
getTile.aspx
340 ms
getTile.aspx
415 ms
getTile.aspx
497 ms
getTile.aspx
573 ms
getTile.aspx
654 ms
getTile.aspx
731 ms
getTile.aspx
770 ms
getTile.aspx
1308 ms
getTile.aspx
848 ms
floodmap.net accessibility score
ARIA
These are opportunities to improve the usage of ARIA in your application which may enhance the experience for users of assistive technology, like a screen reader.
Impact
Issue
[aria-*] attributes do not match their roles
Contrast
These are opportunities to improve the legibility of your content.
Impact
Issue
Background and foreground colors do not have a sufficient contrast ratio.
Names and labels
These are opportunities to improve the semantics of the controls in your application. This may enhance the experience for users of assistive technology, like a screen reader.
Impact
Issue
<frame> or <iframe> elements do not have a title
Image elements do not have [alt] attributes
Form elements do not have associated labels
Links do not have a discernible name
floodmap.net best practices score
Trust and Safety
Impact
Issue
Does not use HTTPS
Includes front-end JavaScript libraries with known security vulnerabilities
Ensure CSP is effective against XSS attacks
User Experience
Impact
Issue
Serves images with low resolution
General
Impact
Issue
Detected JavaScript libraries
Browser errors were logged to the console
Missing source maps for large first-party JavaScript
floodmap.net SEO score
Content Best Practices
Format your HTML in a way that enables crawlers to better understand your app’s content.
Impact
Issue
Image elements do not have [alt] attributes
Mobile Friendly
Make sure your pages are mobile friendly so users don’t have to pinch or zoom in order to read the content pages. [Learn more](https://developers.google.com/search/mobile-sites/).
Impact
Issue
Document uses legible font sizes
EN
N/A
ISO-8859-1
Language claimed in HTML meta tag should match the language actually used on the web page. Otherwise Floodmap.net can be misinterpreted by Google and other search engines. Our service has detected that English is used on the page, and neither this language nor any other was claimed in <html> or <meta> tags. Our system also found out that Floodmap.net main page’s claimed encoding is iso-8859-1. Changing it to UTF-8 can be a good choice, as this format is commonly used for encoding all over the web and thus their visitors won’t have any troubles with symbol transcription or reading.
floodmap.net
Open Graph description is not detected on the main page of Flood Map. Lack of Open Graph description can be counter-productive for their social media presence, as such a description allows converting a website homepage (or other pages) into good-looking, rich and well-structured posts, when it is being shared on Facebook and other social media. For example, adding the following code snippet into HTML <head> tag will help to represent this web page correctly in social networks: