Report Summary

  • 0

    Performance

  • 0

    Accessibility

  • 0

    Best Practices

  • 0

    SEO

lab.ly

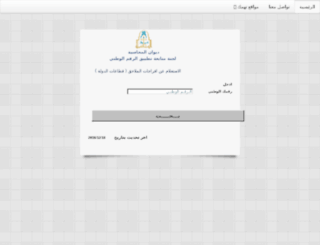
البوابة الالكترونية لديوان المحاسبة

Page Load Speed

4.1 sec in total

First Response

1.3 sec

Resources Loaded

2.7 sec

Page Rendered

141 ms

lab.ly screenshot

About Website

Welcome to lab.ly homepage info - get ready to check Lab best content for Libyan Arab Jamahiriya right away, or after learning these important things about lab.ly

Visit lab.ly

Key Findings

We analyzed Lab.ly page load time and found that the first response time was 1.3 sec and then it took 2.8 sec to load all DOM resources and completely render a web page. This is a poor result, as 50% of websites can load faster. This domain responded with an error, which can significantly jeopardize Lab.ly rating and web reputation

Performance Metrics

lab.ly performance score

0

Network Requests Diagram

lab.ly

1317 ms

style.css

273 ms

uikit.almost-flat.css

972 ms

uikit.gradient.css

981 ms

uikit.gradient.css

282 ms

Our browser made a total of 15 requests to load all elements on the main page. We found that 93% of them (14 requests) were addressed to the original Lab.ly, 7% (1 request) were made to Cgibin.erols.com. The less responsive or slowest element that took the longest time to load (1.3 sec) belongs to the original domain Lab.ly.

Page Optimization Overview & Recommendations

Page size can be reduced by 354.6 kB (80%)

Content Size

441.9 kB

After Optimization

87.2 kB

In fact, the total size of Lab.ly main page is 441.9 kB. This result falls beyond the top 1M of websites and identifies a large and not optimized web page that may take ages to load. Only 10% of websites need less resources to load. CSS take 293.1 kB which makes up the majority of the site volume.

HTML Optimization

-72%

Potential reduce by 9.1 kB

  • Original 12.7 kB
  • After minification 11.3 kB
  • After compression 3.6 kB

HTML content can be minified and compressed by a website’s server. The most efficient way is to compress content using GZIP which reduces data amount travelling through the network between server and browser. HTML code on this page is well minified. It is highly recommended that content of this web page should be compressed using GZIP, as it can save up to 9.1 kB or 72% of the original size.

Image Optimization

-12%

Potential reduce by 1.9 kB

  • Original 15.8 kB
  • After minification 13.9 kB

Image size optimization can help to speed up a website loading time. The chart above shows the difference between the size before and after optimization. Obviously, Lab needs image optimization as it can save up to 1.9 kB or 12% of the original volume. The most popular and efficient tools for JPEG and PNG image optimization are Jpegoptim and PNG Crush.

JavaScript Optimization

-67%

Potential reduce by 80.6 kB

  • Original 120.4 kB
  • After minification 120.4 kB
  • After compression 39.8 kB

It’s better to minify JavaScript in order to improve website performance. The diagram shows the current total size of all JavaScript files against the prospective JavaScript size after its minification and compression. It is highly recommended that all JavaScript files should be compressed and minified as it can save up to 80.6 kB or 67% of the original size.

CSS Optimization

-90%

Potential reduce by 263.1 kB

  • Original 293.1 kB
  • After minification 160.6 kB
  • After compression 29.9 kB

CSS files minification is very important to reduce a web page rendering time. The faster CSS files can load, the earlier a page can be rendered. Lab.ly needs all CSS files to be minified and compressed as it can save up to 263.1 kB or 90% of the original size.

Requests Breakdown

Number of requests can be reduced by 3 (33%)

Requests Now

9

After Optimization

6

The browser has sent 9 CSS, Javascripts, AJAX and image requests in order to completely render the main page of Lab. We recommend that multiple CSS and JavaScript files should be merged into one by each type, as it can help reduce assets requests from 4 to 1 for JavaScripts and as a result speed up the page load time.

SEO Factors

lab.ly SEO score

0

Language and Encoding

  • Language Detected

    AR

  • Language Claimed

    EN

  • Encoding

    UTF-8

Language claimed in HTML meta tag should match the language actually used on the web page. Otherwise Lab.ly can be misinterpreted by Google and other search engines. Our service has detected that Arabic is used on the page, and it does not match the claimed English language. Our system also found out that Lab.ly main page’s claimed encoding is utf-8. Use of this encoding format is the best practice as the main page visitors from all over the world won’t have any issues with symbol transcription.

Social Sharing Optimization

Open Graph description is not detected on the main page of Lab. Lack of Open Graph description can be counter-productive for their social media presence, as such a description allows converting a website homepage (or other pages) into good-looking, rich and well-structured posts, when it is being shared on Facebook and other social media. For example, adding the following code snippet into HTML <head> tag will help to represent this web page correctly in social networks: