3.5 sec in total
516 ms
2.7 sec
311 ms
Click here to check amazing Share Prices content for United Kingdom. Otherwise, check out these important facts you probably never knew about shareprices.com
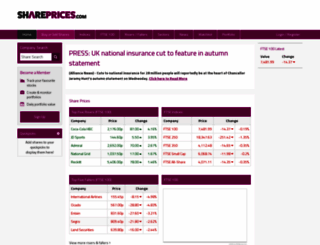
Buy and trade shares online today at shareprices.com. LSE, FTSE 100, FTSE AIM and techMARK Share Price Feeds and Charts
Visit shareprices.comWe analyzed Shareprices.com page load time and found that the first response time was 516 ms and then it took 3 sec to load all DOM resources and completely render a web page. This is a poor result, as 50% of websites can load faster.
shareprices.com performance score
name
value
score
weighting
Value3.0 s
50/100
10%
Value4.4 s
40/100
25%
Value4.9 s
65/100
10%
Value950 ms
30/100
30%
Value0.008
100/100
15%
Value9.5 s
31/100
10%
516 ms
196 ms
528 ms
1073 ms
304 ms
Our browser made a total of 63 requests to load all elements on the main page. We found that 44% of them (28 requests) were addressed to the original Shareprices.com, 14% (9 requests) were made to Dianomioffers.co.uk and 11% (7 requests) were made to Google-analytics.com. The less responsive or slowest element that took the longest time to load (1.1 sec) belongs to the original domain Shareprices.com.
Page size can be reduced by 1.3 MB (68%)
1.9 MB
594.3 kB
In fact, the total size of Shareprices.com main page is 1.9 MB. This result falls beyond the top 1M of websites and identifies a large and not optimized web page that may take ages to load. 55% of websites need less resources to load. Javascripts take 1.3 MB which makes up the majority of the site volume.
Potential reduce by 134.7 kB
HTML content can be minified and compressed by a website’s server. The most efficient way is to compress content using GZIP which reduces data amount travelling through the network between server and browser. HTML code on this page is well minified. It is highly recommended that content of this web page should be compressed using GZIP, as it can save up to 134.7 kB or 77% of the original size.
Potential reduce by 199.3 kB
Image size optimization can help to speed up a website loading time. The chart above shows the difference between the size before and after optimization. Obviously, Share Prices needs image optimization as it can save up to 199.3 kB or 52% of the original volume. The most popular and efficient tools for JPEG and PNG image optimization are Jpegoptim and PNG Crush.
Potential reduce by 890.5 kB
It’s better to minify JavaScript in order to improve website performance. The diagram shows the current total size of all JavaScript files against the prospective JavaScript size after its minification and compression. It is highly recommended that all JavaScript files should be compressed and minified as it can save up to 890.5 kB or 71% of the original size.
Potential reduce by 55.6 kB
CSS files minification is very important to reduce a web page rendering time. The faster CSS files can load, the earlier a page can be rendered. Shareprices.com needs all CSS files to be minified and compressed as it can save up to 55.6 kB or 88% of the original size.
Number of requests can be reduced by 39 (64%)
61
22
The browser has sent 61 CSS, Javascripts, AJAX and image requests in order to completely render the main page of Share Prices. We recommend that multiple CSS and JavaScript files should be merged into one by each type, as it can help reduce assets requests from 17 to 1 for JavaScripts and from 6 to 1 for CSS and as a result speed up the page load time.
shareprices.com
516 ms
positioning4.css
196 ms
screen6.css
528 ms
jquery.js
1073 ms
jquery.als-1.2.min.js
304 ms
thickbox.css
202 ms
thickbox.js
486 ms
addthis_widget.js
15 ms
gmogs_image_90-35_en_blue.js
9 ms
gpt.js
16 ms
analytics.js
29 ms
gtm.js
88 ms
gs_noscript_90-35_en.gif
15 ms
bgnd-page.gif
111 ms
up.gif
206 ms
down.gif
214 ms
bullet.gif
214 ms
get
479 ms
btn-search.gif
213 ms
icon-new.gif
424 ms
chart_line.png
427 ms
folder.png
427 ms
money_pound.png
428 ms
create.png
819 ms
logo-shareprices.png
913 ms
tabletop.png
987 ms
tabletopgrey.gif
606 ms
bgnd-button.jpg
607 ms
smartads.epl
402 ms
pubads_impl_81.js
58 ms
collect
47 ms
container.html
13 ms
bgnd-watchlist.gif
568 ms
nav-grey.png
1089 ms
nav-gold.png
695 ms
collect
57 ms
collect
102 ms
oi-az9s24vi.js
382 ms
smartads.epl
428 ms
bgnd-footer.gif
749 ms
siteSeal.do
393 ms
ads
341 ms
load.sumome.com
301 ms
300lo.json
58 ms
ie67-css.d20541e614a2e495c355.js
18 ms
loadingAnimation.gif
918 ms
sh.7c7179124ea24ac6ba46caac.html
44 ms
layers.3643cb2e25fb91c29386.js
6 ms
1.css
176 ms
expansion_embed.js
12 ms
siteSealImage.do
191 ms
1.css
30 ms
64x80.png
171 ms
64x80.png
246 ms
collect
18 ms
collect
21 ms
80x100.png
419 ms
80x100.png
16 ms
80x100.png
16 ms
collect
11 ms
collect
16 ms
collect
12 ms
print.css
106 ms
shareprices.com accessibility score
Navigation
These are opportunities to improve keyboard navigation in your application.
Impact
Issue
Heading elements are not in a sequentially-descending order
shareprices.com best practices score
Trust and Safety
Impact
Issue
Does not use HTTPS
Ensure CSP is effective against XSS attacks
General
Impact
Issue
Detected JavaScript libraries
Page has valid source maps
shareprices.com SEO score
Crawling and Indexing
To appear in search results, crawlers need access to your app.
Impact
Issue
Links are not crawlable
Mobile Friendly
Make sure your pages are mobile friendly so users don’t have to pinch or zoom in order to read the content pages. [Learn more](https://developers.google.com/search/mobile-sites/).
Impact
Issue
Document uses legible font sizes
Tap targets are not sized appropriately
EN
EN
UTF-8
Language claimed in HTML meta tag should match the language actually used on the web page. Otherwise Shareprices.com can be misinterpreted by Google and other search engines. Our service has detected that English is used on the page, and it matches the claimed language. Our system also found out that Shareprices.com main page’s claimed encoding is utf-8. Use of this encoding format is the best practice as the main page visitors from all over the world won’t have any issues with symbol transcription.
shareprices.com
Open Graph description is not detected on the main page of Share Prices. Lack of Open Graph description can be counter-productive for their social media presence, as such a description allows converting a website homepage (or other pages) into good-looking, rich and well-structured posts, when it is being shared on Facebook and other social media. For example, adding the following code snippet into HTML <head> tag will help to represent this web page correctly in social networks: