Report Summary

  • 69

    Performance

    Renders faster than
    81% of other websites

  • 86

    Accessibility

    Visual factors better than
    that of 62% of websites

  • 67

    Best Practices

    More advanced features
    available than in
    24% of websites

  • 77

    SEO

    Google-friendlier than
    36% of websites

web-sniffer.net

View HTTP Request and Response Header
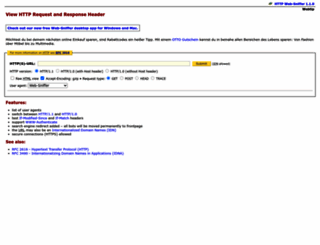
Page Load Speed

908 ms in total

First Response

316 ms

Resources Loaded

503 ms

Page Rendered

89 ms

web-sniffer.net screenshot

About Website

Welcome to web-sniffer.net homepage info - get ready to check Web Sniffer best content for Iran right away, or after learning these important things about web-sniffer.net

view request and response header of a HTTP connection, HTTP status codes and HTML source

Visit web-sniffer.net

Key Findings

We analyzed Web-sniffer.net page load time and found that the first response time was 316 ms and then it took 592 ms to load all DOM resources and completely render a web page. This is quite a good result, as only 10% of websites can load faster.

Performance Metrics

web-sniffer.net performance score

69

Measured Metrics

name

value

score

weighting

FCP (First Contentful Paint)

Value1.1 s

99/100

10%

LCP (Largest Contentful Paint)

Value3.0 s

78/100

25%

SI (Speed Index)

Value1.4 s

100/100

10%

TBT (Total Blocking Time)

Value1,360 ms

16/100

30%

CLS (Cumulative Layout Shift)

Value0

100/100

15%

TTI (Time to Interactive)

Value3.2 s

95/100

10%

Network Requests Diagram

web-sniffer.net

316 ms

basic.css

95 ms

challenge

33 ms

web-sniffer.png

185 ms

recaptcha.js

5 ms

Our browser made a total of 13 requests to load all elements on the main page. We found that 23% of them (3 requests) were addressed to the original Web-sniffer.net, 62% (8 requests) were made to Google.com and 15% (2 requests) were made to Google-analytics.com. The less responsive or slowest element that took the longest time to load (316 ms) belongs to the original domain Web-sniffer.net.

Page Optimization Overview & Recommendations

Page size can be reduced by 140.7 kB (66%)

Content Size

214.5 kB

After Optimization

73.8 kB

In fact, the total size of Web-sniffer.net main page is 214.5 kB. This result falls beyond the top 1M of websites and identifies a large and not optimized web page that may take ages to load. 15% of websites need less resources to load. Javascripts take 187.0 kB which makes up the majority of the site volume.

HTML Optimization

-70%

Potential reduce by 9.5 kB

  • Original 13.5 kB
  • After minification 13.3 kB
  • After compression 4.1 kB

HTML content can be minified and compressed by a website’s server. The most efficient way is to compress content using GZIP which reduces data amount travelling through the network between server and browser. HTML code on this page is well minified. It is highly recommended that content of this web page should be compressed using GZIP, as it can save up to 9.5 kB or 70% of the original size.

Image Optimization

-5%

Potential reduce by 353 B

  • Original 7.6 kB
  • After minification 7.3 kB

Image size optimization can help to speed up a website loading time. The chart above shows the difference between the size before and after optimization. Web Sniffer images are well optimized though.

JavaScript Optimization

-67%

Potential reduce by 126.0 kB

  • Original 187.0 kB
  • After minification 186.9 kB
  • After compression 61.0 kB

It’s better to minify JavaScript in order to improve website performance. The diagram shows the current total size of all JavaScript files against the prospective JavaScript size after its minification and compression. It is highly recommended that all JavaScript files should be compressed and minified as it can save up to 126.0 kB or 67% of the original size.

CSS Optimization

-77%

Potential reduce by 4.9 kB

  • Original 6.3 kB
  • After minification 5.2 kB
  • After compression 1.5 kB

CSS files minification is very important to reduce a web page rendering time. The faster CSS files can load, the earlier a page can be rendered. Web-sniffer.net needs all CSS files to be minified and compressed as it can save up to 4.9 kB or 77% of the original size.

Requests Breakdown

Number of requests can be reduced by 8 (67%)

Requests Now

12

After Optimization

4

The browser has sent 12 CSS, Javascripts, AJAX and image requests in order to completely render the main page of Web Sniffer. We recommend that multiple CSS and JavaScript files should be merged into one by each type, as it can help reduce assets requests from 4 to 1 for JavaScripts and as a result speed up the page load time.

Accessibility Review

web-sniffer.net accessibility score

86

Accessibility Issues

Names and labels

These are opportunities to improve the semantics of the controls in your application. This may enhance the experience for users of assistive technology, like a screen reader.

Impact

Issue

High

Form elements do not have associated labels

Best Practices

web-sniffer.net best practices score

67

Areas of Improvement

Trust and Safety

Impact

Issue

High

Does not use HTTPS

Low

Ensure CSP is effective against XSS attacks

User Experience

Impact

Issue

High

Serves images with low resolution

General

Impact

Issue

High

Browser errors were logged to the console

SEO Factors

web-sniffer.net SEO score

77

Search Engine Optimization Advices

Language and Encoding

  • Language Detected

    EN

  • Language Claimed

    EN

  • Encoding

    UTF-8

Language claimed in HTML meta tag should match the language actually used on the web page. Otherwise Web-sniffer.net can be misinterpreted by Google and other search engines. Our service has detected that English is used on the page, and it matches the claimed language. Our system also found out that Web-sniffer.net main page’s claimed encoding is utf-8. Use of this encoding format is the best practice as the main page visitors from all over the world won’t have any issues with symbol transcription.

Social Sharing Optimization

Open Graph description is not detected on the main page of Web Sniffer. Lack of Open Graph description can be counter-productive for their social media presence, as such a description allows converting a website homepage (or other pages) into good-looking, rich and well-structured posts, when it is being shared on Facebook and other social media. For example, adding the following code snippet into HTML <head> tag will help to represent this web page correctly in social networks: