2.9 sec in total
444 ms
2.3 sec
212 ms
Welcome to c.tt homepage info - get ready to check C best content for China right away, or after learning these important things about c.tt
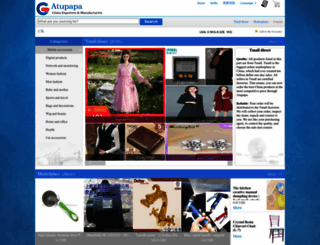
Find quality products at the most discounted price at China Discount Mall. The innovative multi-language international B2B and B2C trade platform. Import and export business at atupapa.com. Buy and se...
Visit c.ttWe analyzed C.tt page load time and found that the first response time was 444 ms and then it took 2.5 sec to load all DOM resources and completely render a web page. This is a poor result, as 50% of websites can load faster.
c.tt performance score
444 ms
94 ms
186 ms
278 ms
370 ms
Our browser made a total of 70 requests to load all elements on the main page. We found that 0% of them (0 request) were addressed to the original C.tt, 1% (1 request) were made to Pagead2.googlesyndication.com. The less responsive or slowest element that took the longest time to load (897 ms) relates to the external source Atupapa.com.
Page size can be reduced by 492.1 kB (50%)
981.0 kB
488.9 kB
In fact, the total size of C.tt main page is 981.0 kB. This result falls beyond the top 1M of websites and identifies a large and not optimized web page that may take ages to load. 40% of websites need less resources to load. Javascripts take 602.9 kB which makes up the majority of the site volume.
Potential reduce by 28.4 kB
HTML content can be minified and compressed by a website’s server. The most efficient way is to compress content using GZIP which reduces data amount travelling through the network between server and browser. HTML code on this page is well minified. It is highly recommended that content of this web page should be compressed using GZIP, as it can save up to 28.4 kB or 75% of the original size.
Potential reduce by 48.4 kB
Image size optimization can help to speed up a website loading time. The chart above shows the difference between the size before and after optimization. Obviously, C needs image optimization as it can save up to 48.4 kB or 15% of the original volume. The most popular and efficient tools for JPEG and PNG image optimization are Jpegoptim and PNG Crush.
Potential reduce by 403.3 kB
It’s better to minify JavaScript in order to improve website performance. The diagram shows the current total size of all JavaScript files against the prospective JavaScript size after its minification and compression. It is highly recommended that all JavaScript files should be compressed and minified as it can save up to 403.3 kB or 67% of the original size.
Potential reduce by 11.9 kB
CSS files minification is very important to reduce a web page rendering time. The faster CSS files can load, the earlier a page can be rendered. C.tt needs all CSS files to be minified and compressed as it can save up to 11.9 kB or 71% of the original size.
Number of requests can be reduced by 13 (19%)
69
56
The browser has sent 69 CSS, Javascripts, AJAX and image requests in order to completely render the main page of C. We recommend that multiple CSS and JavaScript files should be merged into one by each type, as it can help reduce assets requests from 11 to 1 for JavaScripts and from 4 to 1 for CSS and as a result speed up the page load time.
www.atupapa.com
444 ms
ddsmoothmenu.css
94 ms
ddsmoothmenu-v.css
186 ms
top.css
278 ms
fw.js
370 ms
validate.js
406 ms
jquery-2.1.4.min.js
510 ms
ddsmoothmenu.js
415 ms
adsbygoogle.js
167 ms
index_en.css
421 ms
mootools.js
798 ms
duotive-slider-gallery.js
461 ms
jquery_nav.js
897 ms
index.js
505 ms
base.js
587 ms
scrolltopcontrol.js
587 ms
bg_p23.jpg
395 ms
po.png
95 ms
cart.gif
94 ms
3431461000301s.jpg
124 ms
6731364000301s.jpg
187 ms
4386308000301s.jpg
188 ms
7329320000301s.jpg
217 ms
5149365000301s.jpg
372 ms
3030436000301s.jpg
374 ms
6521393000301s.jpg
374 ms
1781420000301s.jpg
393 ms
2514486000301s.jpg
395 ms
6957310000301s.jpg
411 ms
5200382000301s.jpg
411 ms
4129346000301s.jpg
433 ms
7402360000301s.jpg
465 ms
4241384000301s.jpg
464 ms
2270479000301s.jpg
464 ms
5080329000301s.jpg
470 ms
1506473000301s.jpg
492 ms
1411497000301s.jpg
525 ms
4443345000301s.jpg
555 ms
6762388000301s.jpg
555 ms
7289381000301s.jpg
557 ms
4164364000301s.jpg
563 ms
323469000301s.jpg
584 ms
1944466000301s.jpg
617 ms
4703384000301s.jpg
647 ms
3695419000301s.jpg
647 ms
1828468000301s.jpg
652 ms
3046457001081s.png
657 ms
2748466001081s.jpg
648 ms
331394001081s.jpg
663 ms
3228421001081s.jpg
653 ms
3133477001081s.jpg
658 ms
2532477001081s.jpg
632 ms
787317001081s.jpg
587 ms
2111357001081s.jpg
618 ms
500398001081s.jpg
621 ms
3034404001081s.jpg
465 ms
834404001081s.jpg
473 ms
logo.gif
475 ms
top_line.gif
473 ms
m_top_bg_45.gif
505 ms
sch_btn_bg.gif
536 ms
top_line_2.gif
535 ms
maincn_1.gif
529 ms
maincn_2.gif
531 ms
pullDownList-bg.jpg
544 ms
duotive-slideshow-preloader2.gif
557 ms
pic-pos.jpg
558 ms
gr_01.png
557 ms
gallery-slider-content-bg.png
569 ms
topback.jpg
565 ms
c.tt SEO score
EN
EN
UTF-8
Language claimed in HTML meta tag should match the language actually used on the web page. Otherwise C.tt can be misinterpreted by Google and other search engines. Our service has detected that English is used on the page, and it matches the claimed language. Our system also found out that C.tt main page’s claimed encoding is utf-8. Use of this encoding format is the best practice as the main page visitors from all over the world won’t have any issues with symbol transcription.
c.tt
Open Graph description is not detected on the main page of C. Lack of Open Graph description can be counter-productive for their social media presence, as such a description allows converting a website homepage (or other pages) into good-looking, rich and well-structured posts, when it is being shared on Facebook and other social media. For example, adding the following code snippet into HTML <head> tag will help to represent this web page correctly in social networks: