4.5 sec in total
29 ms
3.5 sec
979 ms
Click here to check amazing Catchpoint content for India. Otherwise, check out these important facts you probably never knew about catchpoint.com
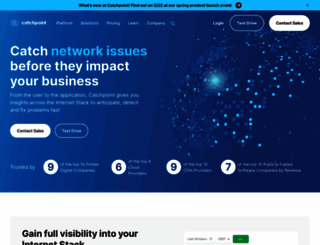
Optimize performance, availability, reliability, and reachability from wherever your customers and employees are with Catchpoint's IPM Suite.
Visit catchpoint.comWe analyzed Catchpoint.com page load time and found that the first response time was 29 ms and then it took 4.4 sec to load all DOM resources and completely render a web page. This is a poor result, as 70% of websites can load faster.
catchpoint.com performance score
name
value
score
weighting
Value3.8 s
28/100
10%
Value6.8 s
7/100
25%
Value8.0 s
22/100
10%
Value5,580 ms
0/100
30%
Value0.012
100/100
15%
Value26.5 s
0/100
10%
29 ms
1999 ms
70 ms
68 ms
119 ms
Our browser made a total of 102 requests to load all elements on the main page. We found that 2% of them (2 requests) were addressed to the original Catchpoint.com, 33% (34 requests) were made to Assets-global.website-files.com and 5% (5 requests) were made to Player.vimeo.com. The less responsive or slowest element that took the longest time to load (2 sec) belongs to the original domain Catchpoint.com.
Page size can be reduced by 403.1 kB (29%)
1.4 MB
985.4 kB
In fact, the total size of Catchpoint.com main page is 1.4 MB. This result falls beyond the top 1M of websites and identifies a large and not optimized web page that may take ages to load. 80% of websites need less resources to load and that’s why Accessify’s recommendations for optimization and resource minification can be helpful for this project. Images take 736.4 kB which makes up the majority of the site volume.
Potential reduce by 234.9 kB
HTML content can be minified and compressed by a website’s server. The most efficient way is to compress content using GZIP which reduces data amount travelling through the network between server and browser. HTML code on this page is well minified. It is highly recommended that content of this web page should be compressed using GZIP, as it can save up to 234.9 kB or 69% of the original size.
Potential reduce by 160.2 kB
Image size optimization can help to speed up a website loading time. The chart above shows the difference between the size before and after optimization. Obviously, Catchpoint needs image optimization as it can save up to 160.2 kB or 22% of the original volume. The most popular and efficient tools for JPEG and PNG image optimization are Jpegoptim and PNG Crush.
Potential reduce by 8.0 kB
It’s better to minify JavaScript in order to improve website performance. The diagram shows the current total size of all JavaScript files against the prospective JavaScript size after its minification and compression. This website has mostly compressed JavaScripts.
Potential reduce by 0 B
CSS files minification is very important to reduce a web page rendering time. The faster CSS files can load, the earlier a page can be rendered. Catchpoint.com has all CSS files already compressed.
Number of requests can be reduced by 49 (52%)
95
46
The browser has sent 95 CSS, Javascripts, AJAX and image requests in order to completely render the main page of Catchpoint. We recommend that multiple CSS and JavaScript files should be merged into one by each type, as it can help reduce assets requests from 36 to 1 for JavaScripts and as a result speed up the page load time.
www.catchpoint.com
29 ms
www.catchpoint.com
1999 ms
cp-2021.822085024.min.css
70 ms
webfont.js
68 ms
weglot.min.js
119 ms
player.js
118 ms
jquery-3.5.1.min.dc5e7f18c8.js
114 ms
cp-2021.2e47a331c.js
115 ms
swiper-bundle.min.js
113 ms
he.min.js
82 ms
css
53 ms
j.php
131 ms
gtm.js
232 ms
a8qxwzsxso
141 ms
65da516fbffdd2638ab4f411_close%20dark.svg
106 ms
677395987
167 ms
677394291
244 ms
678394581
308 ms
679285932
245 ms
65b3d92d7128b6f1998014e8_20240126T0408-8f3081c6-b4b2-404b-901c-ba200233e9cc.png
76 ms
66421823cdd23e44ef2ab8b7_Internet-stack-map-2%20(1).webp
75 ms
627d2a698fdb88ec572a328b_search.svg
68 ms
65c6757401e600138a7a44e3_home-globe-bg.webp
78 ms
65ca951699fc9248ba97c5ee_feature-dash.webp
74 ms
663e7c5efab244d7603be2e0_Internet-stack-map-1%20(1).webp
71 ms
65ca9521f91d0680ff58fc62_feature-geo.webp
76 ms
65ca952a609365229b15dd23_feature-analytics.webp
83 ms
65ca9642c74a98ea53fabd7b_home-team.webp
83 ms
622757cc4a29b9401a1e034c_big-SAP-Video-Thumbnail.webp
82 ms
621c74a6a39925930292ec38_Cox-Video-Thumbnail.webp
81 ms
65e460574c508134a500b57d_354px-Cox_Automotive_logo.svg.png
82 ms
623d6d88197f5f197cf658ff_Cloudinary-video-thumbnail2.webp
81 ms
65caf093ec0f85586a51d304_cloudinary-logo.svg
89 ms
65e772ad20acca2c90ea6e07_2024%20sre%20report%20cover.webp
88 ms
663a94a2e91649831be64c8e_Spring%202024%20product%20launch%20-%20400x225.png
92 ms
6632b07aec974fe909a062c8_master%20class%202%20-%20resource%20library%20-%20800x450%20-%20no%20CTA.png
94 ms
6632be8bd1a6ec4229b778bc_DORA-checklist.png
94 ms
65caf4c319e728071d29df62_TrustRadius%20Badge.png
88 ms
65eaf2980f2dff05954c71bb_DigitalEmployeeExperience(DEX)Management_EasiestToDoBusinessWith_EaseOfDoingBusinessWith%202.svg
123 ms
65eaf0573a1bade248791c48_NetworkMonitoring_HighPerformer_Enterprise_HighPerformer%202.svg
130 ms
65eaf298fd75b4b30d5be097_NetworkMonitoring_BestSupport_Enterprise_QualityOfSupport%203.svg
125 ms
65eaf0830a0a4e2860ff538b_NetworkMonitoring_Leader_Leader%203.svg
124 ms
65caf546ce05b130596fc199_NetworkMonitoring_UsersMostLikelyToRecommend_Enterprise_Nps%201.png
127 ms
65eaf29894118d61f57d2e8f_NetworkMonitoring_BestRelationship_Enterprise_Total%203.svg
121 ms
65eaf2af35dd68e3b0ec6bbc_NetworkMonitoring_UsersMostLikelyToRecommend_Enterprise_Nps%202.svg
134 ms
65caf5ac9583cfe537c8d86c_DigitalEmployeeExperience(DEX)Management_HighPerformer_HighPerformer%201.png
133 ms
621d928f278ddfef9740b9da_linkedin.svg
137 ms
650ac818b2e5c2dee134f4bd_logo-white.png
138 ms
610ba35b825cf2018442706e_facebook.svg
137 ms
621d928fb84eb98449a445d4_youtube.svg
136 ms
65c66de9a8ace80a0b082b8d_Inter-VariableFont_slnt%2Cwght.ttf
89 ms
QldgNThLqRwH-OJ1UHjlKENVzkWGVkL3GZQmAwLYxYWI2qfdm7Lpp4U8WR32kQ.woff
42 ms
QldgNThLqRwH-OJ1UHjlKENVzkWGVkL3GZQmAwLYxYWI2qfdm7Lpp2I7WR32kQ.woff
81 ms
clarity.js
57 ms
1769001094-de41f54246f1fc206e5bca0f71a21fc24a8c466bfb640040ae11ea6945a5b573-d
43 ms
1372897870-daf01994ec63704004e38dada73f751f5d6b033f0978307a6d82d9a57f49a88c-d
62 ms
1376498895-cef67ad6569be8ed7fd418199ae9f86548cf96a21e98a69c46bb76579bab8dee-d
59 ms
analytics.js
147 ms
insight.min.js
74 ms
uwt.js
161 ms
destination
69 ms
pixel.js
387 ms
fbevents.js
150 ms
5595333.js
474 ms
bat.js
399 ms
tfa.js
399 ms
tracking.js
478 ms
95b8549b.min.js
384 ms
623367930ab9b2001c94d9d6
961 ms
js
134 ms
1374817629-1c5d1f2b2772c9382a87d7482ea68b2b98fef698baf63e30182863400c169095-d
38 ms
collect
253 ms
rp.gif
160 ms
t2_vplqsl7k_telemetry
95 ms
sync
178 ms
collect
147 ms
js
107 ms
json
184 ms
adsct
325 ms
adsct
313 ms
oct.js
75 ms
collectedforms.js
169 ms
fb.js
133 ms
leadflows.js
136 ms
banner.js
177 ms
conversations-embed.js
171 ms
5595333.js
178 ms
web-interactives-embed.js
176 ms
ga-audiences
130 ms
sync
73 ms
tap.php
78 ms
adsct
237 ms
adsct
188 ms
li_sync
55 ms
cds-pips.js
19 ms
eid.es5.js
23 ms
ip.json
99 ms
pips.taboola.com
53 ms
gif.gif
55 ms
rum
58 ms
log
55 ms
collect
20 ms
catchpoint.com accessibility score
ARIA
These are opportunities to improve the usage of ARIA in your application which may enhance the experience for users of assistive technology, like a screen reader.
Impact
Issue
ARIA input fields do not have accessible names
Contrast
These are opportunities to improve the legibility of your content.
Impact
Issue
Background and foreground colors do not have a sufficient contrast ratio.
Names and labels
These are opportunities to improve the semantics of the controls in your application. This may enhance the experience for users of assistive technology, like a screen reader.
Impact
Issue
<frame> or <iframe> elements do not have a title
Image elements do not have [alt] attributes
Links do not have a discernible name
Best practices
These items highlight common accessibility best practices.
Impact
Issue
[user-scalable="no"] is used in the <meta name="viewport"> element or the [maximum-scale] attribute is less than 5.
catchpoint.com best practices score
Trust and Safety
Impact
Issue
Does not use HTTPS
Ensure CSP is effective against XSS attacks
General
Impact
Issue
Detected JavaScript libraries
Browser errors were logged to the console
Missing source maps for large first-party JavaScript
catchpoint.com SEO score
Content Best Practices
Format your HTML in a way that enables crawlers to better understand your app’s content.
Impact
Issue
Links do not have descriptive text
Image elements do not have [alt] attributes
Crawling and Indexing
To appear in search results, crawlers need access to your app.
Impact
Issue
robots.txt is not valid
Mobile Friendly
Make sure your pages are mobile friendly so users don’t have to pinch or zoom in order to read the content pages. [Learn more](https://developers.google.com/search/mobile-sites/).
Impact
Issue
Document uses legible font sizes
Tap targets are not sized appropriately
EN
EN
UTF-8
Language claimed in HTML meta tag should match the language actually used on the web page. Otherwise Catchpoint.com can be misinterpreted by Google and other search engines. Our service has detected that English is used on the page, and it matches the claimed language. Our system also found out that Catchpoint.com main page’s claimed encoding is utf-8. Use of this encoding format is the best practice as the main page visitors from all over the world won’t have any issues with symbol transcription.
catchpoint.com
Open Graph data is detected on the main page of Catchpoint. This is the best way to make the web page social media friendly. Here is how it looks like on Facebook: