4.8 sec in total
180 ms
3.4 sec
1.2 sec
Visit coppertreeanalytics.com now to see the best up-to-date Copper Tree Analytics content for Canada and also check out these interesting facts you probably never knew about coppertreeanalytics.com
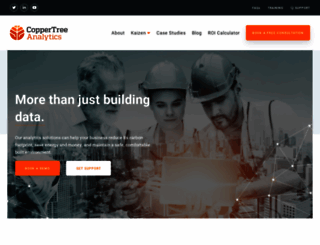
Our analytics solutions can help your business reduce its carbon footprint, save energy and money, and maintain a comfortable built environment.
Visit coppertreeanalytics.comWe analyzed Coppertreeanalytics.com page load time and found that the first response time was 180 ms and then it took 4.6 sec to load all DOM resources and completely render a web page. This is a poor result, as 70% of websites can load faster.
coppertreeanalytics.com performance score
name
value
score
weighting
Value3.4 s
36/100
10%
Value16.7 s
0/100
25%
Value7.7 s
24/100
10%
Value2,010 ms
7/100
30%
Value0.058
98/100
15%
Value16.5 s
5/100
10%
180 ms
957 ms
213 ms
58 ms
72 ms
Our browser made a total of 78 requests to load all elements on the main page. We found that 76% of them (59 requests) were addressed to the original Coppertreeanalytics.com, 8% (6 requests) were made to Use.typekit.net and 5% (4 requests) were made to Cdnjs.cloudflare.com. The less responsive or slowest element that took the longest time to load (1.3 sec) belongs to the original domain Coppertreeanalytics.com.
Page size can be reduced by 122.4 kB (4%)
3.0 MB
2.8 MB
In fact, the total size of Coppertreeanalytics.com main page is 3.0 MB. This result falls beyond the top 1M of websites and identifies a large and not optimized web page that may take ages to load. 60% of websites need less resources to load. Images take 2.7 MB which makes up the majority of the site volume.
Potential reduce by 57.4 kB
HTML content can be minified and compressed by a website’s server. The most efficient way is to compress content using GZIP which reduces data amount travelling through the network between server and browser. This page needs HTML code to be minified as it can gain 14.3 kB, which is 20% of the original size. It is highly recommended that content of this web page should be compressed using GZIP, as it can save up to 57.4 kB or 81% of the original size.
Potential reduce by 18.7 kB
Image size optimization can help to speed up a website loading time. The chart above shows the difference between the size before and after optimization. Copper Tree Analytics images are well optimized though.
Potential reduce by 6.8 kB
It’s better to minify JavaScript in order to improve website performance. The diagram shows the current total size of all JavaScript files against the prospective JavaScript size after its minification and compression. This website has mostly compressed JavaScripts.
Potential reduce by 39.5 kB
CSS files minification is very important to reduce a web page rendering time. The faster CSS files can load, the earlier a page can be rendered. Coppertreeanalytics.com needs all CSS files to be minified and compressed as it can save up to 39.5 kB or 45% of the original size.
Number of requests can be reduced by 17 (24%)
70
53
The browser has sent 70 CSS, Javascripts, AJAX and image requests in order to completely render the main page of Copper Tree Analytics. We recommend that multiple CSS and JavaScript files should be merged into one by each type, as it can help reduce assets requests from 11 to 1 for JavaScripts and from 8 to 1 for CSS and as a result speed up the page load time.
coppertreeanalytics.com
180 ms
www.coppertreeanalytics.com
957 ms
style.min.css
213 ms
css
58 ms
all.css
72 ms
jquery.fancybox.min.css
60 ms
slick.min.css
68 ms
ciz3sfv.css
102 ms
main-style.css
244 ms
jquery.min.js
52 ms
email-decode.min.js
42 ms
jquery.fancybox.min.js
82 ms
slick.min.js
73 ms
50817bbbeb.js
108 ms
site-js.js
433 ms
maps.js
434 ms
calc.js
433 ms
vcd15cbe7772f49c399c6a5babf22c1241717689176015
74 ms
p.css
22 ms
gtm.js
221 ms
logo.svg
333 ms
fractal.svg
354 ms
fractal_right.svg
335 ms
Clock_Icon.svg
341 ms
Trust_Icon.svg
356 ms
Insights_Icon.svg
350 ms
Kaizen-on-Computer-1-scaled.jpg
546 ms
Easy_Icon.svg
544 ms
Lightbulb_icon.svg
547 ms
Premium_Icon.svg
568 ms
Padlock_Icon.svg
561 ms
Team_Icon.svg
565 ms
Checklist_Icon.svg
752 ms
01_CEE-Primary-logo-dark-01.png
756 ms
horizon_health_network.jpeg
746 ms
BCI.jpeg
756 ms
delta_school_district.png
777 ms
DeltaBuildingTech_logo_Final01.png
766 ms
EA_Horiz_Digital_Color_Tagline.png
943 ms
ecube-logo.jpg
957 ms
Emcor-Mesa-Inc-Logo-HiRes.jpg
956 ms
ENGIE-Logo-Gradient-Blue-Full.png
955 ms
EU_shield_hz_280.jpg
990 ms
integral.jpg
974 ms
ESC-automation-e1610732138796.png
1151 ms
LONG-Logo-002.png
1172 ms
NB_Colour.jpg
1163 ms
Service_New_Brunswick_Logo.svg_.png
1165 ms
sodexo.png
1168 ms
YVR-logo-lg.jpg
1186 ms
pcl_col-C_3-1-e1606516563426.png
1347 ms
delta-controls-logo-no-background-1-e1610732175647.png
1237 ms
Microsoft-Logo-2012.jpg
1229 ms
Belimo_Logo_big_1_RGB.png
1236 ms
Ohio-State-New.jpg
1252 ms
d
46 ms
d
57 ms
d
57 ms
fa-brands-400.woff
57 ms
d
57 ms
d
57 ms
1200px-Canberra_Airport_logo.svg.png
1251 ms
2745229.js
190 ms
Hullmark_wordmark_black.png
1123 ms
KMCLogo2017-4-Color.png
1221 ms
MBP_logo_gray.jpg
1245 ms
BAC-Logo.png
1217 ms
enviseLogo.png
1233 ms
logo_ashrae.png
1252 ms
WFU_Univ_V_RGB.jpg
1123 ms
Equans-Logo.png
1207 ms
AdobeStock_192596344-1-scaled-e1606925915698.jpeg
1231 ms
FAQ_Icon.svg
1236 ms
Support_Icon.svg
1229 ms
Blog2_Icon.svg
1235 ms
footer_logo.svg
1136 ms
CopperTreeHomepageHero-1-1800x890.jpg
1219 ms
AdobeStock_116443664-1-1800x1200.jpeg
1223 ms
coppertreeanalytics.com accessibility score
Contrast
These are opportunities to improve the legibility of your content.
Impact
Issue
Background and foreground colors do not have a sufficient contrast ratio.
Navigation
These are opportunities to improve keyboard navigation in your application.
Impact
Issue
Heading elements are not in a sequentially-descending order
Names and labels
These are opportunities to improve the semantics of the controls in your application. This may enhance the experience for users of assistive technology, like a screen reader.
Impact
Issue
Image elements do not have [alt] attributes
Links do not have a discernible name
Best practices
These items highlight common accessibility best practices.
Impact
Issue
[user-scalable="no"] is used in the <meta name="viewport"> element or the [maximum-scale] attribute is less than 5.
coppertreeanalytics.com best practices score
Trust and Safety
Impact
Issue
Does not use HTTPS
Includes front-end JavaScript libraries with known security vulnerabilities
Ensure CSP is effective against XSS attacks
General
Impact
Issue
Detected JavaScript libraries
Page has valid source maps
coppertreeanalytics.com SEO score
Content Best Practices
Format your HTML in a way that enables crawlers to better understand your app’s content.
Impact
Issue
Links do not have descriptive text
Image elements do not have [alt] attributes
Mobile Friendly
Make sure your pages are mobile friendly so users don’t have to pinch or zoom in order to read the content pages. [Learn more](https://developers.google.com/search/mobile-sites/).
Impact
Issue
Document uses legible font sizes
Tap targets are not sized appropriately
EN
EN
UTF-8
Language claimed in HTML meta tag should match the language actually used on the web page. Otherwise Coppertreeanalytics.com can be misinterpreted by Google and other search engines. Our service has detected that English is used on the page, and it matches the claimed language. Our system also found out that Coppertreeanalytics.com main page’s claimed encoding is utf-8. Use of this encoding format is the best practice as the main page visitors from all over the world won’t have any issues with symbol transcription.
coppertreeanalytics.com
Open Graph data is detected on the main page of Copper Tree Analytics. This is the best way to make the web page social media friendly. Here is how it looks like on Facebook: