10.1 sec in total
422 ms
9.5 sec
264 ms
Click here to check amazing Foot Factor content. Otherwise, check out these important facts you probably never knew about footfactor.com
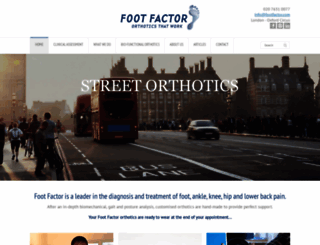
Bespoke Orthotics London. Expert biomechanical analysis and custom orthotics created while you wait. Resolve pain and improve performance
Visit footfactor.comWe analyzed Footfactor.com page load time and found that the first response time was 422 ms and then it took 9.7 sec to load all DOM resources and completely render a web page. This is a poor result, as 90% of websites can load faster.
footfactor.com performance score
name
value
score
weighting
Value4.4 s
16/100
10%
Value7.0 s
6/100
25%
Value11.6 s
4/100
10%
Value1,370 ms
16/100
30%
Value0.118
85/100
15%
Value15.0 s
8/100
10%
422 ms
3087 ms
366 ms
376 ms
368 ms
Our browser made a total of 101 requests to load all elements on the main page. We found that 80% of them (81 requests) were addressed to the original Footfactor.com, 5% (5 requests) were made to Fonts.googleapis.com and 4% (4 requests) were made to Fonts.gstatic.com. The less responsive or slowest element that took the longest time to load (3.1 sec) belongs to the original domain Footfactor.com.
Page size can be reduced by 338.8 kB (13%)
2.7 MB
2.4 MB
In fact, the total size of Footfactor.com main page is 2.7 MB. This result falls beyond the top 1M of websites and identifies a large and not optimized web page that may take ages to load. 60% of websites need less resources to load. Images take 2.1 MB which makes up the majority of the site volume.
Potential reduce by 98.3 kB
HTML content can be minified and compressed by a website’s server. The most efficient way is to compress content using GZIP which reduces data amount travelling through the network between server and browser. HTML code on this page is well minified. It is highly recommended that content of this web page should be compressed using GZIP, as it can save up to 98.3 kB or 80% of the original size.
Potential reduce by 51.9 kB
Image size optimization can help to speed up a website loading time. The chart above shows the difference between the size before and after optimization. Foot Factor images are well optimized though.
Potential reduce by 161.8 kB
It’s better to minify JavaScript in order to improve website performance. The diagram shows the current total size of all JavaScript files against the prospective JavaScript size after its minification and compression. It is highly recommended that all JavaScript files should be compressed and minified as it can save up to 161.8 kB or 33% of the original size.
Potential reduce by 26.8 kB
CSS files minification is very important to reduce a web page rendering time. The faster CSS files can load, the earlier a page can be rendered. Footfactor.com needs all CSS files to be minified and compressed as it can save up to 26.8 kB or 83% of the original size.
Number of requests can be reduced by 50 (66%)
76
26
The browser has sent 76 CSS, Javascripts, AJAX and image requests in order to completely render the main page of Foot Factor. We recommend that multiple CSS and JavaScript files should be merged into one by each type, as it can help reduce assets requests from 28 to 1 for JavaScripts and from 24 to 1 for CSS and as a result speed up the page load time.
footfactor.com
422 ms
footfactor.com
3087 ms
wp-emoji-release.min.js
366 ms
sbi-styles.min.css
376 ms
layerslider.css
368 ms
css
47 ms
style.min.css
370 ms
styles.css
377 ms
afe-styles.min.css
376 ms
normalize.css
716 ms
rt-css-framework.css
708 ms
fontello.css
722 ms
jackbox.min.css
716 ms
style.css
728 ms
owl.carousel.css
709 ms
flexslider.css
1032 ms
progression-player.css
1028 ms
skin-minimal-light.css
1061 ms
isotope.css
1066 ms
colortip-1.0-jquery.css
1058 ms
animate.css
1063 ms
blue-style.css
1370 ms
css
60 ms
css
65 ms
css
66 ms
css
67 ms
style.css
1370 ms
script.min.js
1397 ms
jquery.min.js
1404 ms
jquery-migrate.min.js
1394 ms
layerslider.utils.js
1395 ms
layerslider.kreaturamedia.jquery.js
1694 ms
layerslider.transitions.js
1683 ms
modernizr.min.js
1723 ms
js
79 ms
wp-polyfill.min.js
1713 ms
index.js
1712 ms
jquery.easing.1.3.js
1761 ms
jquery.tools.min.js
2007 ms
waitforimages.min.js
2013 ms
waypoints.min.js
2034 ms
mediaelement-and-player.min.js
2036 ms
jackbox-packed.min.js
2039 ms
api.js
45 ms
colortip-1.0-jquery.js
2038 ms
jquery.flexslider.js
1971 ms
script.js
1969 ms
index.js
1986 ms
wp-embed.min.js
1981 ms
owl.carousel.min.js
1989 ms
sbi-scripts.min.js
1982 ms
FF_logo_transparent.png
461 ms
Everyday-orthotics-slide-update2.jpg
1232 ms
button.png
913 ms
Runnning-orthotics-slide-updated.jpg
1184 ms
Golf-orthotics-slide-new2.jpg
1257 ms
custom-orthotics-London.jpg
1096 ms
Orthotics-home-square2.jpg
1033 ms
home-orthotics-new.jpg
1392 ms
shoe-orthotics.jpg
1435 ms
run-orthotics.jpg
1604 ms
golf-insoles.jpg
1681 ms
ski-insoles-london.jpg
1743 ms
cycling-insoles.jpg
1829 ms
running-orthotics-explained-480x240.jpg
1791 ms
golf-orthotics-480x240.jpg
1825 ms
Footfactor-Pelvic-pain-480x240.jpg
1998 ms
holiday-shoes-1200x628-1-480x240.jpg
2079 ms
placeholder.png
2060 ms
jizaRExUiTo99u79D0KEwA.ttf
73 ms
fontello.woff
2049 ms
BngRUXNadjH0qYEzV7ab-oWlsbCIwRg.ttf
82 ms
BngSUXNadjH0qYEzV7ab-oWlsbg95AiLW_g.ttf
86 ms
wp-polyfill-fetch.min.js
2039 ms
wp-polyfill-dom-rect.min.js
2025 ms
wp-polyfill-url.min.js
2197 ms
wp-polyfill-formdata.min.js
2259 ms
wp-polyfill-element-closest.min.js
2263 ms
wp-polyfill-object-fit.min.js
2294 ms
fontello.ttf
411 ms
recaptcha__en.js
98 ms
analytics.js
127 ms
loading.gif
320 ms
Clinic-Blue-testimonials.jpg
337 ms
456763925_813542234099092_2979836289808667317_nlow.jpg
322 ms
454407525_872114814826888_7253172427391685603_nlow.jpg
329 ms
451292104_507932115221843_8492640787372516691_nlow.jpg
318 ms
452450522_1220949382553656_7145419836297830221_nlow.jpg
324 ms
452069163_457194797164221_4417968034293396353_nlow.jpg
602 ms
skin.css
579 ms
EJRVQgYoZZY2vCFuvAFWzro.ttf
42 ms
fontello.svg
614 ms
collect
13 ms
js
55 ms
451292104_507932115221843_8492640787372516691_n.jpg
782 ms
456763925_813542234099092_2979836289808667317_n.jpg
731 ms
452450522_1220949382553656_7145419836297830221_n.jpg
763 ms
454407525_872114814826888_7253172427391685603_n.jpg
712 ms
452069163_457194797164221_4417968034293396353_n.jpg
692 ms
nothumb.png
312 ms
Clinic-Blue-testimonials.jpg
310 ms
footfactor.com accessibility score
Contrast
These are opportunities to improve the legibility of your content.
Impact
Issue
Background and foreground colors do not have a sufficient contrast ratio.
Names and labels
These are opportunities to improve the semantics of the controls in your application. This may enhance the experience for users of assistive technology, like a screen reader.
Impact
Issue
Links do not have a discernible name
Tables and lists
These are opportunities to improve the experience of reading tabular or list data using assistive technology, like a screen reader.
Impact
Issue
Lists do not contain only <li> elements and script supporting elements (<script> and <template>).
Best practices
These items highlight common accessibility best practices.
Impact
Issue
[user-scalable="no"] is used in the <meta name="viewport"> element or the [maximum-scale] attribute is less than 5.
footfactor.com best practices score
Trust and Safety
Impact
Issue
Does not use HTTPS
Ensure CSP is effective against XSS attacks
General
Impact
Issue
Detected JavaScript libraries
Browser errors were logged to the console
footfactor.com SEO score
Content Best Practices
Format your HTML in a way that enables crawlers to better understand your app’s content.
Impact
Issue
Links do not have descriptive text
Mobile Friendly
Make sure your pages are mobile friendly so users don’t have to pinch or zoom in order to read the content pages. [Learn more](https://developers.google.com/search/mobile-sites/).
Impact
Issue
Document uses legible font sizes
Tap targets are not sized appropriately
EN
EN
UTF-8
Language claimed in HTML meta tag should match the language actually used on the web page. Otherwise Footfactor.com can be misinterpreted by Google and other search engines. Our service has detected that English is used on the page, and it matches the claimed language. Our system also found out that Footfactor.com main page’s claimed encoding is utf-8. Use of this encoding format is the best practice as the main page visitors from all over the world won’t have any issues with symbol transcription.
footfactor.com
Open Graph data is detected on the main page of Foot Factor. This is the best way to make the web page social media friendly. Here is how it looks like on Facebook: