3.1 sec in total
30 ms
1.7 sec
1.4 sec
Welcome to gastrograph.com homepage info - get ready to check Gastrograph best content right away, or after learning these important things about gastrograph.com
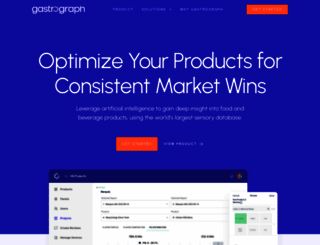
Leverage artificial intelligence to gain deep insight into food and beverage products, using the world’s largest sensory database.
Visit gastrograph.comWe analyzed Gastrograph.com page load time and found that the first response time was 30 ms and then it took 3.1 sec to load all DOM resources and completely render a web page. This is a poor result, as 55% of websites can load faster.
gastrograph.com performance score
name
value
score
weighting
Value3.3 s
39/100
10%
Value5.4 s
20/100
25%
Value3.3 s
90/100
10%
Value360 ms
72/100
30%
Value0.229
55/100
15%
Value6.9 s
54/100
10%
30 ms
58 ms
1008 ms
113 ms
49 ms
Our browser made a total of 55 requests to load all elements on the main page. We found that 5% of them (3 requests) were addressed to the original Gastrograph.com, 55% (30 requests) were made to Cdn.prod.website-files.com and 16% (9 requests) were made to Fonts.gstatic.com. The less responsive or slowest element that took the longest time to load (1 sec) belongs to the original domain Gastrograph.com.
Page size can be reduced by 246.7 kB (9%)
2.8 MB
2.5 MB
In fact, the total size of Gastrograph.com main page is 2.8 MB. This result falls beyond the top 1M of websites and identifies a large and not optimized web page that may take ages to load. 75% of websites need less resources to load and that’s why Accessify’s recommendations for optimization and resource minification can be helpful for this project. Images take 2.5 MB which makes up the majority of the site volume.
Potential reduce by 84.6 kB
HTML content can be minified and compressed by a website’s server. The most efficient way is to compress content using GZIP which reduces data amount travelling through the network between server and browser. HTML code on this page is well minified. It is highly recommended that content of this web page should be compressed using GZIP, as it can save up to 84.6 kB or 81% of the original size.
Potential reduce by 160.5 kB
Image size optimization can help to speed up a website loading time. The chart above shows the difference between the size before and after optimization. Gastrograph images are well optimized though.
Potential reduce by 453 B
It’s better to minify JavaScript in order to improve website performance. The diagram shows the current total size of all JavaScript files against the prospective JavaScript size after its minification and compression. This website has mostly compressed JavaScripts.
Potential reduce by 1.1 kB
CSS files minification is very important to reduce a web page rendering time. The faster CSS files can load, the earlier a page can be rendered. Gastrograph.com has all CSS files already compressed.
Number of requests can be reduced by 10 (23%)
43
33
The browser has sent 43 CSS, Javascripts, AJAX and image requests in order to completely render the main page of Gastrograph. We recommend that multiple CSS and JavaScript files should be merged into one by each type, as it can help reduce assets requests from 6 to 1 for JavaScripts and as a result speed up the page load time.
gastrograph.com
30 ms
gastrograph.com
58 ms
www.gastrograph.com
1008 ms
gastrograph-46329eb781cd466bf1381f882c5.webflow.f355e51c2.css
113 ms
webfont.js
49 ms
js
91 ms
js
162 ms
weglot.min.js
67 ms
jquery-3.5.1.min.dc5e7f18c8.js
47 ms
webflow.5019942bb.js
118 ms
css
59 ms
63c97bb83ae4b61b2d1cfa84_logo-horizontal_blue.svg
229 ms
63c5a0a3483629673ccaafc8_bg-dots-dark.svg
162 ms
63c5a0a348362981d3caafc3_embed-1.svg
159 ms
63c5a0a3483629b363caafcb_embed-2.svg
168 ms
63c5a0a3483629ce65caafcf_embed-3.svg
170 ms
63c5a0a348362929a9caafc7_bg-dots-light.svg
170 ms
63c5a0a3483629fdf5cab03a_USA.svg
196 ms
63c5a0a34836293c53cab03c_Japan.svg
195 ms
63bf7b361d393a85b1705c5b_gb.svg
200 ms
63bf7b361d393a0b91705c59_es.svg
201 ms
63bf7b361d393a96a9705c57_de.svg
198 ms
63bf7b361d393a1882705c58_fr.svg
200 ms
63bf7b361d393a8e71705c5a_ru.svg
251 ms
63c97bd921758a79324c12e7_logo-horizontal_white.svg
252 ms
63c70dbb1990ee776d5680ec_gg-product-hero.png
256 ms
63c711e17cf4b65494197a3b_purepng.png
251 ms
63c711ce1e792e31e11fe6c1_Pernod-Ricard-logo-1631748484.png
252 ms
63c5a0a348362937c2caafdf_grupo-bimbo-logo.png
253 ms
63c711d9794e2d42607c6d31_Mondelez-logo.png
274 ms
63c5a0a348362939c4cab037_Develop%20new%20products-hero.png
385 ms
63c5a0a34836299b25caafcc_graphic-3.svg
278 ms
63c5a0a34836298254caafce_graphic-1.png
372 ms
63c5a0a3483629651dcaafca_dots-black-small-top.svg
274 ms
63c5a0a3483629cd51caafc9_dots-black-small-bottom.svg
276 ms
63c5a0a34836297404caafc4_image-1.png
309 ms
63c5a0a3483629b9f6caafc5_image-2.png
311 ms
63c5a0a34836290839caafc6_image3.png
311 ms
63c5a0a3483629da5acaafba_sony-logo-PNG-20px.png
310 ms
63c5a0a34836293255caafbb_grupo-bimbo-logo-0%201_testimonial.png
312 ms
63c5a0a34836291073caafbc_BASF-Logo%201_testimonial.png
311 ms
63c5a0a3483629044bcab051_featured-image-atlantic.png
312 ms
63c5a0a3483629ad6dcab052_feature-atlantic.png
315 ms
63c5a0a34836290fe3cab047_featured-image-eater.png
314 ms
63c5a0a3483629a912cab050_feature-eater.png
315 ms
63c84d8ca85eb16167463485_Logo-wordmark.svg
317 ms
L0xjDF02iFML4hGCyOCpRdycFsGxSrqDyx4vEZmv.ttf
70 ms
L0xjDF02iFML4hGCyOCpRdycFsGxSrqD-R4vEZmv.ttf
100 ms
L0xjDF02iFML4hGCyOCpRdycFsGxSrqDlR4vEZmv.ttf
101 ms
L0xjDF02iFML4hGCyOCpRdycFsGxSrqDSx4vEZmv.ttf
119 ms
L0xjDF02iFML4hGCyOCpRdycFsGxSrqDyx8vEZmv.ttf
119 ms
L0xjDF02iFML4hGCyOCpRdycFsGxSrqDFRkvEZmv.ttf
117 ms
L0xjDF02iFML4hGCyOCpRdycFsGxSrqDLBkvEZmv.ttf
120 ms
L0xjDF02iFML4hGCyOCpRdycFsGxSrqDSxkvEZmv.ttf
118 ms
L0xjDF02iFML4hGCyOCpRdycFsGxSrqDYhkvEZmv.ttf
119 ms
gastrograph.com accessibility score
Contrast
These are opportunities to improve the legibility of your content.
Impact
Issue
Background and foreground colors do not have a sufficient contrast ratio.
Navigation
These are opportunities to improve keyboard navigation in your application.
Impact
Issue
Heading elements are not in a sequentially-descending order
Internationalization and localization
These are opportunities to improve the interpretation of your content by users in different locales.
Impact
Issue
<html> element does not have a [lang] attribute
Names and labels
These are opportunities to improve the semantics of the controls in your application. This may enhance the experience for users of assistive technology, like a screen reader.
Impact
Issue
Links do not have a discernible name
gastrograph.com best practices score
Trust and Safety
Impact
Issue
Does not use HTTPS
Ensure CSP is effective against XSS attacks
General
Impact
Issue
Detected JavaScript libraries
gastrograph.com SEO score
Content Best Practices
Format your HTML in a way that enables crawlers to better understand your app’s content.
Impact
Issue
Links do not have descriptive text
Mobile Friendly
Make sure your pages are mobile friendly so users don’t have to pinch or zoom in order to read the content pages. [Learn more](https://developers.google.com/search/mobile-sites/).
Impact
Issue
Document uses legible font sizes
EN
N/A
UTF-8
Language claimed in HTML meta tag should match the language actually used on the web page. Otherwise Gastrograph.com can be misinterpreted by Google and other search engines. Our service has detected that English is used on the page, and neither this language nor any other was claimed in <html> or <meta> tags. Our system also found out that Gastrograph.com main page’s claimed encoding is utf-8. Use of this encoding format is the best practice as the main page visitors from all over the world won’t have any issues with symbol transcription.
gastrograph.com
Open Graph data is detected on the main page of Gastrograph. This is the best way to make the web page social media friendly. Here is how it looks like on Facebook: