4.7 sec in total
322 ms
3.9 sec
458 ms
Click here to check amazing Blog Hpcloud content for India. Otherwise, check out these important facts you probably never knew about blog.hpcloud.com
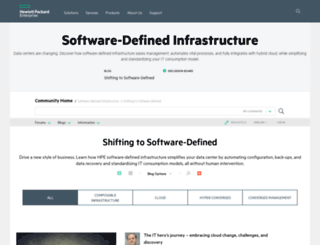
Drive a new style of business. Learn how HPE software-defined infrastructure simplifies your data center by automating configuration, back-ups, and data recovery
Visit blog.hpcloud.comWe analyzed Blog.hpcloud.com page load time and found that the first response time was 322 ms and then it took 4.4 sec to load all DOM resources and completely render a web page. This is a poor result, as 65% of websites can load faster.
blog.hpcloud.com performance score
322 ms
170 ms
741 ms
63 ms
655 ms
Our browser made a total of 82 requests to load all elements on the main page. We found that 1% of them (1 request) were addressed to the original Blog.hpcloud.com, 45% (37 requests) were made to Community.hpe.com and 15% (12 requests) were made to Tags.tiqcdn.com. The less responsive or slowest element that took the longest time to load (2.1 sec) relates to the external source Community.hpe.com.
Page size can be reduced by 1.9 MB (72%)
2.6 MB
729.7 kB
In fact, the total size of Blog.hpcloud.com main page is 2.6 MB. This result falls beyond the top 1M of websites and identifies a large and not optimized web page that may take ages to load. 65% of websites need less resources to load. Javascripts take 1.5 MB which makes up the majority of the site volume.
Potential reduce by 231.6 kB
HTML content can be minified and compressed by a website’s server. The most efficient way is to compress content using GZIP which reduces data amount travelling through the network between server and browser. HTML code on this page is well minified. It is highly recommended that content of this web page should be compressed using GZIP, as it can save up to 231.6 kB or 80% of the original size.
Potential reduce by 593.7 kB
Image size optimization can help to speed up a website loading time. The chart above shows the difference between the size before and after optimization. Obviously, Blog Hpcloud needs image optimization as it can save up to 593.7 kB or 72% of the original volume. The most popular and efficient tools for JPEG and PNG image optimization are Jpegoptim and PNG Crush.
Potential reduce by 1.1 MB
It’s better to minify JavaScript in order to improve website performance. The diagram shows the current total size of all JavaScript files against the prospective JavaScript size after its minification and compression. It is highly recommended that all JavaScript files should be compressed and minified as it can save up to 1.1 MB or 71% of the original size.
Potential reduce by 2.7 kB
CSS files minification is very important to reduce a web page rendering time. The faster CSS files can load, the earlier a page can be rendered. Blog.hpcloud.com needs all CSS files to be minified and compressed as it can save up to 2.7 kB or 80% of the original size.
Number of requests can be reduced by 38 (56%)
68
30
The browser has sent 68 CSS, Javascripts, AJAX and image requests in order to completely render the main page of Blog Hpcloud. We recommend that multiple CSS and JavaScript files should be merged into one by each type, as it can help reduce assets requests from 36 to 1 for JavaScripts and from 4 to 1 for CSS and as a result speed up the page load time.
blog.hpcloud.com
322 ms
sws-661
170 ms
sws-661
741 ms
utag.sync.js
63 ms
hpebsplitpeak-439108329.css
655 ms
jquery.js
25 ms
jquery.ui.core.js
32 ms
can.jquery.js
30 ms
hpe-fontface-core.css
78 ms
hpe-hf-r.css
77 ms
hpe-hf-r-jq.js
30 ms
hpe-autocomplete-loader-2-jq.js
28 ms
hpe-autocomplete-loader-store-jq.js
28 ms
hpe-hf-init-r-jq.js
30 ms
hpe-caas-privacy-cookie.js
31 ms
jquery-1.10.2.min.js
470 ms
bootstrap.min.js
307 ms
jquery-labelauty.js
229 ms
jquery-labelauty.css
226 ms
lia-scripts-head-min.js
468 ms
utag.sync.js
22 ms
utag.js
7 ms
addthis_widget.js
11 ms
lia-scripts-angularjs-min.js
675 ms
lia-scripts-angularjsModules-min.js
676 ms
lia-scripts-common-min.js
675 ms
lia-scripts-body-min.js
673 ms
privacy_cookie.JS
55 ms
hpe-logo-white.png
33 ms
icon_help.png
169 ms
large
541 ms
60x60
171 ms
large
1045 ms
60x60
280 ms
medium
369 ms
60x60
281 ms
medium
540 ms
0%2C0%2C1295%2C1619
369 ms
large
1049 ms
large
1047 ms
65191iF17FC6885A52A4CF
1047 ms
VivitEventsLogo2.png
1044 ms
60x60
1045 ms
message
1049 ms
message
1047 ms
hpe-logo-printable.png
28 ms
select-arrow.png
2073 ms
icon_arrow_down_grey.png
1025 ms
HPEBC_IconSet_Vertical_1200_2x.png
1057 ms
Metric-Regular.woff
978 ms
hpe-hf-icons-ttf.ttf
96 ms
latin-e-regular-ttf.ttf
95 ms
Metric-Medium.woff
978 ms
Metric-Bold.woff
1108 ms
fontawesome-webfont.woff
1192 ms
Metric-Semibold.woff
1269 ms
Metric-Light.woff
1295 ms
icon_read_more.png
1123 ms
hpe-flag.png
88 ms
latin-e-light-ttf.ttf
163 ms
latin-e-semibold-ttf.ttf
162 ms
utag.126.js
429 ms
utag.348.js
433 ms
utag.408.js
433 ms
utag.67.js
429 ms
utag.72.js
430 ms
utag.73.js
430 ms
utag.223.js
431 ms
utag.228.js
432 ms
utag.574.js
432 ms
hpe-hf-sprite-img-r.gif
328 ms
ladybug.jsp
276 ms
300lo.json
155 ms
sh.7c7179124ea24ac6ba46caac.html
87 ms
jumpid_capture.html
111 ms
id
70 ms
iframe_api
58 ms
56 ms
26 ms
id
14 ms
www-widgetapi.js
27 ms
s39641464157029
14 ms
blog.hpcloud.com SEO score
EN
EN
UTF-8
Language claimed in HTML meta tag should match the language actually used on the web page. Otherwise Blog.hpcloud.com can be misinterpreted by Google and other search engines. Our service has detected that English is used on the page, and it matches the claimed language. Our system also found out that Blog.hpcloud.com main page’s claimed encoding is utf-8. Use of this encoding format is the best practice as the main page visitors from all over the world won’t have any issues with symbol transcription.
blog.hpcloud.com
Open Graph data is detected on the main page of Blog Hpcloud. This is the best way to make the web page social media friendly. Here is how it looks like on Facebook: