2.8 sec in total
237 ms
2 sec
499 ms
Visit infogr.am now to see the best up-to-date Infogr content for United States and also check out these interesting facts you probably never knew about infogr.am
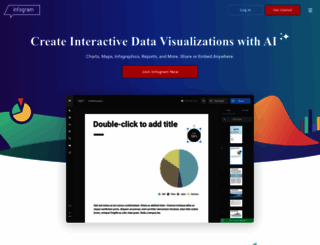
Infogram is an easy-to-use, AI-powered tool for creating stunning infographics, charts, dashboards, maps, and more. Effortlessly design and share interactive data visualizations across various platfor...
Visit infogr.amWe analyzed Infogr.am page load time and found that the first response time was 237 ms and then it took 2.5 sec to load all DOM resources and completely render a web page. This is a poor result, as 50% of websites can load faster.
infogr.am performance score
name
value
score
weighting
Value3.8 s
26/100
10%
Value11.4 s
0/100
25%
Value8.5 s
18/100
10%
Value3,420 ms
2/100
30%
Value0.087
93/100
15%
Value19.0 s
3/100
10%
237 ms
271 ms
401 ms
57 ms
442 ms
Our browser made a total of 72 requests to load all elements on the main page. We found that 3% of them (2 requests) were addressed to the original Infogr.am, 85% (61 requests) were made to Cdn.jifo.co and 4% (3 requests) were made to Cdn.cookielaw.org. The less responsive or slowest element that took the longest time to load (628 ms) relates to the external source Cdn.jifo.co.
Page size can be reduced by 237.9 kB (19%)
1.2 MB
993.9 kB
In fact, the total size of Infogr.am main page is 1.2 MB. This result falls beyond the top 1M of websites and identifies a large and not optimized web page that may take ages to load. 40% of websites need less resources to load. Images take 531.3 kB which makes up the majority of the site volume.
Potential reduce by 237.8 kB
HTML content can be minified and compressed by a website’s server. The most efficient way is to compress content using GZIP which reduces data amount travelling through the network between server and browser. HTML code on this page is well minified. It is highly recommended that content of this web page should be compressed using GZIP, as it can save up to 237.8 kB or 76% of the original size.
Potential reduce by 0 B
Image size optimization can help to speed up a website loading time. The chart above shows the difference between the size before and after optimization. Infogr images are well optimized though.
Potential reduce by 47 B
It’s better to minify JavaScript in order to improve website performance. The diagram shows the current total size of all JavaScript files against the prospective JavaScript size after its minification and compression. This website has mostly compressed JavaScripts.
Number of requests can be reduced by 18 (26%)
69
51
The browser has sent 69 CSS, Javascripts, AJAX and image requests in order to completely render the main page of Infogr. We recommend that multiple CSS and JavaScript files should be merged into one by each type, as it can help reduce assets requests from 7 to 1 for JavaScripts and as a result speed up the page load time.
infogr.am
237 ms
infogr.am
271 ms
infogram.com
401 ms
css
57 ms
css
442 ms
otSDKStub.js
57 ms
snippet.js
46 ms
client
74 ms
bundle_vendor-6e07c47ad59cbe457956-1-webpack.js
74 ms
frontpage_react-12c035ae8d642aa9ac34-1-webpack.js
628 ms
1e0c323c-8c0a-467a-8699-566a2f1931b5.json
63 ms
c64f01cf48c39a610522cea62d62890e.svg
73 ms
f6db75d82744fd7a56ad20fd622056d0.svg
71 ms
f9dbf1850d66f21d9551068d4be186b2.svg
380 ms
eb9d5b7fa7a1308ee5c4fe5cde4a89f2.png
376 ms
2f0bf84185d1b9da1dc43a2eacdd53bd.png
71 ms
f4a985662e54f89028d033ba8fe997a4.png
82 ms
ace210eafc155904ae9556e376437632.png
83 ms
e4e23edd1996036b025ac5c152e14ac9.png
87 ms
ff830722f5b427064fe92bc0226a8f62.svg
96 ms
b2bfa8fcc3ab6aaa9e457b2cececde36.svg
100 ms
3ebb1d47b00dfc7b064efbfa125c6df2.png
102 ms
b731b40bcc2980f5ea1e54db51331133.png
424 ms
8bdc9420b07ca9f4eb1a35615175dd7b.png
113 ms
0bd93514f1d56cd4715540794cc5d29a.png
115 ms
69237fb0364faf826578155453fc2445.png
133 ms
2feda4fc9034e618ae2da865107c87e8.svg
135 ms
dfc95f066a8f4bc1a257bd2c02146250.svg
139 ms
8e1f68fd0d0c1621b1bcd3b8a0c95a2b.png
153 ms
ac05e670caa7745a84f00d95a0b6c27d.png
156 ms
59861c35fa7a3344ad963ddd294e6234.png
168 ms
287393c5abde78cabab4adcbfc54fc68.png
174 ms
80e8bcc3cfc26018dfe69f6b446ff487.svg
184 ms
06d9b65d85ac75093914f382cae72eb8.svg
189 ms
b43bb628b0fbad4475fbb2ace359559b.svg
200 ms
d9e15b0842dbd12f6a194034979b26d0.png
209 ms
3de15e2c47b9ff7d28ae09b6c79bfef3.png
523 ms
7baeedfb5bae152d2b040263ad745dfd.png
226 ms
73e6a7b73be6adc18ce24b8d4f97a8c1.png
247 ms
7479b6b6a13fcf725f910bb60a0c1337.png
255 ms
72e24b3d57a4db13c446486c819077ae.svg
264 ms
304a420c4f88b2f32b366eb761d3daec.svg
600 ms
fe268d070141a8fd1838097825ec31af.svg
291 ms
1d09f305547dcd8a0bc4a01f34015ea3.png
305 ms
816b5a1e49df3031b2c7aa7c857c49f6.png
320 ms
31d9032bcf4980fa5547d90858e41033.png
333 ms
location
48 ms
71dc0a762a16cabedd0327175c6b34d6.png
281 ms
a67ad6c5cb28ce269151061e0fd24f75.svg
294 ms
6d0e778df6064fee7848d669edf4e47f.svg
312 ms
4a66172d7b8e82bdcf737352bdc67fae.svg
325 ms
7922b7f2ef74a7252cf9bd76d8cd230e.svg
626 ms
464e0d31b0b8d18cc2b1edd865edb4ce.svg
312 ms
9283f420b07894983b6163d42cacfae7.svg
317 ms
otBannerSdk.js
21 ms
f9c658a90741bc81b487a100c5e00eda.svg
331 ms
2461e7c091eaf68ce2ae75514fcb135d.svg
325 ms
1ceef656ffd3d39d32c68001f95297a1.svg
326 ms
98c2c13e2c48a60a82492f24aa5b19b4.svg
325 ms
a4899f6205d673a15f86dd7e4727de29.svg
317 ms
da841795fb082dfaa34e9db5aefb7261.svg
317 ms
cc51c4e37739a66339b0b8ed5934c289.svg
328 ms
826225ee624891d7846c0d75024c2053.svg
312 ms
31059a7b9c4daa3f45f562f7f71342da.png
323 ms
cd293c2be20e93f7bcffd915ce9b80fd.svg
316 ms
9672802c0fa635268728a82b0ba1d332.svg
308 ms
3335d32d10e1a10259dbee174494f151.svg
306 ms
bb6c895c6007d816e9815fab28526179.svg
306 ms
3ea3a5d29670b08c2cbdb0a919bd5a75.svg
297 ms
70f5a2d75d02f8de4764f652f5823ec8.svg
297 ms
a071c77516f09dd321079ae44f05ee9b.svg
281 ms
1556cf048ecb2993e31acacd8af582ab.svg
286 ms
infogr.am accessibility score
ARIA
These are opportunities to improve the usage of ARIA in your application which may enhance the experience for users of assistive technology, like a screen reader.
Impact
Issue
button, link, and menuitem elements do not have accessible names.
Contrast
These are opportunities to improve the legibility of your content.
Impact
Issue
Background and foreground colors do not have a sufficient contrast ratio.
Navigation
These are opportunities to improve keyboard navigation in your application.
Impact
Issue
Heading elements are not in a sequentially-descending order
infogr.am best practices score
Trust and Safety
Impact
Issue
Does not use HTTPS
Includes front-end JavaScript libraries with known security vulnerabilities
Ensure CSP is effective against XSS attacks
General
Impact
Issue
Detected JavaScript libraries
infogr.am SEO score
Content Best Practices
Format your HTML in a way that enables crawlers to better understand your app’s content.
Impact
Issue
Links do not have descriptive text
Mobile Friendly
Make sure your pages are mobile friendly so users don’t have to pinch or zoom in order to read the content pages. [Learn more](https://developers.google.com/search/mobile-sites/).
Impact
Issue
Document uses legible font sizes
Tap targets are not sized appropriately
EN
EN
UTF-8
Language claimed in HTML meta tag should match the language actually used on the web page. Otherwise Infogr.am can be misinterpreted by Google and other search engines. Our service has detected that English is used on the page, and it matches the claimed language. Our system also found out that Infogr.am main page’s claimed encoding is utf-8. Use of this encoding format is the best practice as the main page visitors from all over the world won’t have any issues with symbol transcription.
infogr.am
Open Graph data is detected on the main page of Infogr. This is the best way to make the web page social media friendly. Here is how it looks like on Facebook: