bestcities.milkeninstitute.org
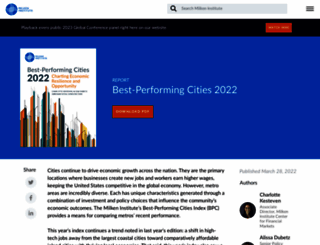
Best-Performing Cities 2022
Page Load Speed
2 sec in total
First Response
162 ms
Resources Loaded
1.5 sec
Page Rendered
299 ms
About Website
Welcome to bestcities.milkeninstitute.org homepage info - get ready to check Best Cities Milkeninstitute best content for United States right away, or after learning these important things about bestcities.milkeninstitute.org
The Milken Institute’s Best-Performing Cities Index (BPC) compares the recent performance of metro areas throughout the United States. The 2022 index continues a trend noted in last year’s edition: a ...
Visit bestcities.milkeninstitute.orgKey Findings
We analyzed Bestcities.milkeninstitute.org page load time and found that the first response time was 162 ms and then it took 1.8 sec to load all DOM resources and completely render a web page. This is quite a good result, as only 35% of websites can load faster.