Report Summary

  • 58

    Performance

    Renders faster than
    74% of other websites

  • 83

    Accessibility

    Visual factors better than
    that of 56% of websites

  • 67

    Best Practices

    More advanced features
    available than in
    24% of websites

  • 97

    SEO

    Google-friendlier than
    91% of websites

renewables-map.co.uk

Renewable Energy Map - The Biggest resource of its kind in the UK

Page Load Speed

7.5 sec in total

First Response

3.1 sec

Resources Loaded

4.2 sec

Page Rendered

236 ms

renewables-map.co.uk screenshot

About Website

Welcome to renewables-map.co.uk homepage info - get ready to check Renewable S Map best content for United Kingdom right away, or after learning these important things about renewables-map.co.uk

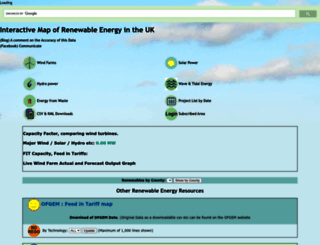
The renewables map has grown to be the biggest and most complete energy map and database of its type in the UK. Projects cover Wind, Solar, Waste, Hydro and FITs

Visit renewables-map.co.uk

Key Findings

We analyzed Renewables-map.co.uk page load time and found that the first response time was 3.1 sec and then it took 4.4 sec to load all DOM resources and completely render a web page. This is a poor result, as 65% of websites can load faster.

Performance Metrics

renewables-map.co.uk performance score

58

Measured Metrics

name

value

score

weighting

FCP (First Contentful Paint)

Value3.2 s

43/100

10%

LCP (Largest Contentful Paint)

Value3.7 s

57/100

25%

SI (Speed Index)

Value6.0 s

46/100

10%

TBT (Total Blocking Time)

Value360 ms

72/100

30%

CLS (Cumulative Layout Shift)

Value0.158

73/100

15%

TTI (Time to Interactive)

Value10.0 s

26/100

10%

Network Requests Diagram

renewables-map.co.uk

3100 ms

map-main.css

331 ms

jsapi

16 ms

header.jpg

90 ms

wind%20icon1.png

179 ms

Our browser made a total of 57 requests to load all elements on the main page. We found that 19% of them (11 requests) were addressed to the original Renewables-map.co.uk, 18% (10 requests) were made to O.twimg.com and 16% (9 requests) were made to Pbs.twimg.com. The less responsive or slowest element that took the longest time to load (3.1 sec) belongs to the original domain Renewables-map.co.uk.

Page Optimization Overview & Recommendations

Page size can be reduced by 452.8 kB (36%)

Content Size

1.3 MB

After Optimization

821.1 kB

In fact, the total size of Renewables-map.co.uk main page is 1.3 MB. This result falls beyond the top 1M of websites and identifies a large and not optimized web page that may take ages to load. 55% of websites need less resources to load. Images take 627.9 kB which makes up the majority of the site volume.

HTML Optimization

-79%

Potential reduce by 109.1 kB

  • Original 138.3 kB
  • After minification 122.5 kB
  • After compression 29.1 kB

HTML content can be minified and compressed by a website’s server. The most efficient way is to compress content using GZIP which reduces data amount travelling through the network between server and browser. This page needs HTML code to be minified as it can gain 15.8 kB, which is 11% of the original size. It is highly recommended that content of this web page should be compressed using GZIP, as it can save up to 109.1 kB or 79% of the original size.

Image Optimization

-7%

Potential reduce by 41.0 kB

  • Original 627.9 kB
  • After minification 586.9 kB

Image size optimization can help to speed up a website loading time. The chart above shows the difference between the size before and after optimization. Renewable S Map images are well optimized though.

JavaScript Optimization

-57%

Potential reduce by 256.1 kB

  • Original 452.8 kB
  • After minification 452.8 kB
  • After compression 196.7 kB

It’s better to minify JavaScript in order to improve website performance. The diagram shows the current total size of all JavaScript files against the prospective JavaScript size after its minification and compression. It is highly recommended that all JavaScript files should be compressed and minified as it can save up to 256.1 kB or 57% of the original size.

CSS Optimization

-85%

Potential reduce by 46.6 kB

  • Original 55.0 kB
  • After minification 49.4 kB
  • After compression 8.4 kB

CSS files minification is very important to reduce a web page rendering time. The faster CSS files can load, the earlier a page can be rendered. Renewables-map.co.uk needs all CSS files to be minified and compressed as it can save up to 46.6 kB or 85% of the original size.

Requests Breakdown

Number of requests can be reduced by 21 (38%)

Requests Now

55

After Optimization

34

The browser has sent 55 CSS, Javascripts, AJAX and image requests in order to completely render the main page of Renewable S Map. We recommend that multiple CSS and JavaScript files should be merged into one by each type, as it can help reduce assets requests from 11 to 1 for JavaScripts and from 7 to 1 for CSS and as a result speed up the page load time.

Accessibility Review

renewables-map.co.uk accessibility score

83

Accessibility Issues

Contrast

These are opportunities to improve the legibility of your content.

Impact

Issue

High

Background and foreground colors do not have a sufficient contrast ratio.

Navigation

These are opportunities to improve keyboard navigation in your application.

Impact

Issue

High

Heading elements are not in a sequentially-descending order

Names and labels

These are opportunities to improve the semantics of the controls in your application. This may enhance the experience for users of assistive technology, like a screen reader.

Impact

Issue

High

Form elements do not have associated labels

High

Links do not have a discernible name

Best Practices

renewables-map.co.uk best practices score

67

Areas of Improvement

Trust and Safety

Impact

Issue

High

Does not use HTTPS

Low

Ensure CSP is effective against XSS attacks

User Experience

Impact

Issue

High

Displays images with incorrect aspect ratio

High

Serves images with low resolution

General

Impact

Issue

High

Browser errors were logged to the console

SEO Factors

renewables-map.co.uk SEO score

97

Search Engine Optimization Advices

Mobile Friendly

Make sure your pages are mobile friendly so users don’t have to pinch or zoom in order to read the content pages. [Learn more](https://developers.google.com/search/mobile-sites/).

Impact

Issue

High

Document uses legible font sizes

High

Tap targets are not sized appropriately

Language and Encoding

  • Language Detected

    EN

  • Language Claimed

    N/A

  • Encoding

    ISO-8859-1

Language claimed in HTML meta tag should match the language actually used on the web page. Otherwise Renewables-map.co.uk can be misinterpreted by Google and other search engines. Our service has detected that English is used on the page, and neither this language nor any other was claimed in <html> or <meta> tags. Our system also found out that Renewables-map.co.uk main page’s claimed encoding is iso-8859-1. Changing it to UTF-8 can be a good choice, as this format is commonly used for encoding all over the web and thus their visitors won’t have any troubles with symbol transcription or reading.

Social Sharing Optimization

Open Graph description is not detected on the main page of Renewable S Map. Lack of Open Graph description can be counter-productive for their social media presence, as such a description allows converting a website homepage (or other pages) into good-looking, rich and well-structured posts, when it is being shared on Facebook and other social media. For example, adding the following code snippet into HTML <head> tag will help to represent this web page correctly in social networks: