1.7 sec in total
186 ms
1.3 sec
275 ms
Click here to check amazing CCARE Stanford content for United States. Otherwise, check out these important facts you probably never knew about ccare.stanford.edu
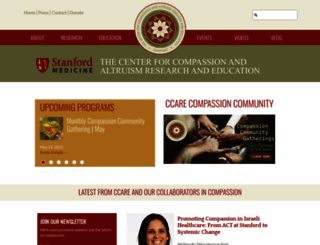
CCARE investigates methods for cultivating compassion and promoting altruism within individuals and society.
Visit ccare.stanford.eduWe analyzed Ccare.stanford.edu page load time and found that the first response time was 186 ms and then it took 1.5 sec to load all DOM resources and completely render a web page. This is quite a good result, as only 30% of websites can load faster.
ccare.stanford.edu performance score
name
value
score
weighting
Value4.1 s
21/100
10%
Value4.1 s
46/100
25%
Value5.7 s
50/100
10%
Value900 ms
31/100
30%
Value0.006
100/100
15%
Value11.1 s
20/100
10%
186 ms
152 ms
60 ms
116 ms
85 ms
Our browser made a total of 106 requests to load all elements on the main page. We found that 75% of them (80 requests) were addressed to the original Ccare.stanford.edu, 7% (7 requests) were made to Fonts.gstatic.com and 5% (5 requests) were made to Fonts.googleapis.com. The less responsive or slowest element that took the longest time to load (343 ms) belongs to the original domain Ccare.stanford.edu.
Page size can be reduced by 432.1 kB (23%)
1.9 MB
1.4 MB
In fact, the total size of Ccare.stanford.edu main page is 1.9 MB. This result falls beyond the top 1M of websites and identifies a large and not optimized web page that may take ages to load. 75% of websites need less resources to load and that’s why Accessify’s recommendations for optimization and resource minification can be helpful for this project. Images take 843.4 kB which makes up the majority of the site volume.
Potential reduce by 62.9 kB
HTML content can be minified and compressed by a website’s server. The most efficient way is to compress content using GZIP which reduces data amount travelling through the network between server and browser. HTML code on this page is well minified. It is highly recommended that content of this web page should be compressed using GZIP, as it can save up to 62.9 kB or 79% of the original size.
Potential reduce by 26.0 kB
Image size optimization can help to speed up a website loading time. The chart above shows the difference between the size before and after optimization. CCARE Stanford images are well optimized though.
Potential reduce by 336.1 kB
It’s better to minify JavaScript in order to improve website performance. The diagram shows the current total size of all JavaScript files against the prospective JavaScript size after its minification and compression. It is highly recommended that all JavaScript files should be compressed and minified as it can save up to 336.1 kB or 40% of the original size.
Potential reduce by 7.0 kB
CSS files minification is very important to reduce a web page rendering time. The faster CSS files can load, the earlier a page can be rendered. Ccare.stanford.edu has all CSS files already compressed.
Number of requests can be reduced by 68 (72%)
94
26
The browser has sent 94 CSS, Javascripts, AJAX and image requests in order to completely render the main page of CCARE Stanford. We recommend that multiple CSS and JavaScript files should be merged into one by each type, as it can help reduce assets requests from 41 to 1 for JavaScripts and from 23 to 1 for CSS and as a result speed up the page load time.
ccare.stanford.edu
186 ms
ccare.stanford.edu
152 ms
style.css
60 ms
style.min.css
116 ms
mediaelementplayer-legacy.min.css
85 ms
wp-mediaelement.min.css
92 ms
views-frontend.css
93 ms
aiwp-public.css
91 ms
style.css
90 ms
styles.css
111 ms
style.css
121 ms
wpr-hamburger.css
121 ms
wprmenu.css
123 ms
wpr-icons.css
124 ms
main.css
139 ms
css
35 ms
dashicons.min.css
169 ms
toolset_maps_fixes.css
150 ms
genesis-overrides.css
152 ms
full-width.css
218 ms
toolset-common-es-frontend.js
221 ms
jquery.min.js
193 ms
jquery-migrate.min.js
182 ms
aiwp-public.js
233 ms
hrf-script.js
221 ms
expand.js
215 ms
modernizr.custom.js
235 ms
touchSwipe.js
247 ms
wprmenu.js
247 ms
core.min.js
250 ms
menu.min.js
254 ms
selectmenu.min.js
253 ms
tooltip.min.js
249 ms
moment.min.js
289 ms
main.js
338 ms
buttons.js
16 ms
shortcodes.css
293 ms
ctct-plugin-recaptcha-v2.min.js
277 ms
api.js
40 ms
ctct-plugin-frontend.min.js
283 ms
index.js
282 ms
buttons.js
14 ms
css
17 ms
css
22 ms
css
23 ms
css
22 ms
index.js
251 ms
hoverIntent.min.js
238 ms
superfish.min.js
229 ms
superfish.args.min.js
232 ms
skip-links.min.js
233 ms
browsetag-2.js
247 ms
datepicker.min.js
343 ms
mouse.min.js
337 ms
slider.min.js
334 ms
jquery.ui.touch-punch.js
331 ms
mediaelement-and-player.min.js
333 ms
mediaelement-migrate.min.js
331 ms
wp-mediaelement.min.js
315 ms
underscore.min.js
303 ms
wp-util.min.js
303 ms
backbone.min.js
286 ms
wp-playlist.min.js
273 ms
views-frontend.js
264 ms
1.jpg
79 ms
1.jpg
77 ms
1.jpg
76 ms
CCARE-logo-4.png
78 ms
SOM-1.png
77 ms
LeeEskey-EVENTS-100x100.png
79 ms
fall24overlay.jpg%22
76 ms
bg-slice-2.jpg
78 ms
university-logo.png
215 ms
upper-quotes.png
215 ms
lower-quotes.png
214 ms
manifesting.jpg
168 ms
Mind-Magic-200.jpg
215 ms
PeterShannonPost.jpg
292 ms
CatherineSchweikertAuthor.jpg
334 ms
Follow-CCARE-White-4-1.png
214 ms
wARDj0u
4 ms
S6u9w4BMUTPHh7USSwiPHA.ttf
85 ms
S6uyw4BMUTPHjx4wWw.ttf
86 ms
S6u9w4BMUTPHh6UVSwiPHA.ttf
135 ms
TK3_WkUHHAIjg75cFRf3bXL8LICs169vsUZiYA.ttf
145 ms
TK3_WkUHHAIjg75cFRf3bXL8LICs1_FvsUZiYA.ttf
134 ms
OZpEg_xvsDZQL_LKIF7q4jP3w2j_.ttf
146 ms
OZpbg_xvsDZQL_LKIF7q4jP_eE3vcKnd.ttf
147 ms
follow_button.html
245 ms
like.php
135 ms
compassion-educaion-heading-tabs-full.png
198 ms
slider-bottom-bg-2.jpg
196 ms
box-3.png
196 ms
footer-bottom-2.jpg
237 ms
footer-follow-us-bg-2.jpg
236 ms
Twitter-icon-white-4.png
239 ms
Facebook-icon-white-4.png
240 ms
LinkedIn-icon-white-4.png
239 ms
YouTube-icon-white-4.png
250 ms
Instagram-icon-white-4.png
264 ms
recaptcha__en.js
100 ms
y-w6ncCxpsQ.js
82 ms
FEppCFCt76d.png
72 ms
fall24overlay.jpg
244 ms
y-w6ncCxpsQ.js
8 ms
embeds
101 ms
ccare.stanford.edu accessibility score
Contrast
These are opportunities to improve the legibility of your content.
Impact
Issue
Background and foreground colors do not have a sufficient contrast ratio.
Names and labels
These are opportunities to improve the semantics of the controls in your application. This may enhance the experience for users of assistive technology, like a screen reader.
Impact
Issue
Image elements do not have [alt] attributes
Links do not have a discernible name
ccare.stanford.edu best practices score
Trust and Safety
Impact
Issue
Does not use HTTPS
Ensure CSP is effective against XSS attacks
User Experience
Impact
Issue
Serves images with low resolution
General
Impact
Issue
Detected JavaScript libraries
Browser errors were logged to the console
Page has valid source maps
Issues were logged in the Issues panel in Chrome Devtools
ccare.stanford.edu SEO score
Content Best Practices
Format your HTML in a way that enables crawlers to better understand your app’s content.
Impact
Issue
Image elements do not have [alt] attributes
Mobile Friendly
Make sure your pages are mobile friendly so users don’t have to pinch or zoom in order to read the content pages. [Learn more](https://developers.google.com/search/mobile-sites/).
Impact
Issue
Document uses legible font sizes
Tap targets are not sized appropriately
EN
EN
UTF-8
Language claimed in HTML meta tag should match the language actually used on the web page. Otherwise Ccare.stanford.edu can be misinterpreted by Google and other search engines. Our service has detected that English is used on the page, and it matches the claimed language. Our system also found out that Ccare.stanford.edu main page’s claimed encoding is utf-8. Use of this encoding format is the best practice as the main page visitors from all over the world won’t have any issues with symbol transcription.
ccare.stanford.edu
Open Graph data is detected on the main page of CCARE Stanford. This is the best way to make the web page social media friendly. Here is how it looks like on Facebook: