5.9 sec in total
333 ms
2.9 sec
2.6 sec
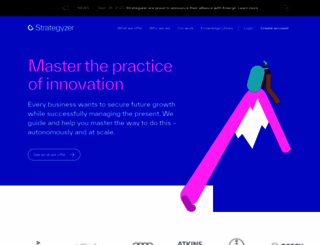
Visit cdn.strategyzer.com now to see the best up-to-date Cdn Strategyzer content for United States and also check out these interesting facts you probably never knew about cdn.strategyzer.com
Trusted Corporate Innovation Strategy, Training, Tools and Software. Creators of the Business Model Canvas.
Visit cdn.strategyzer.comWe analyzed Cdn.strategyzer.com page load time and found that the first response time was 333 ms and then it took 5.5 sec to load all DOM resources and completely render a web page. This is a poor result, as 75% of websites can load faster.
cdn.strategyzer.com performance score
name
value
score
weighting
Value10.4 s
0/100
10%
Value13.8 s
0/100
25%
Value10.4 s
8/100
10%
Value870 ms
33/100
30%
Value0
100/100
15%
Value14.4 s
9/100
10%
333 ms
1694 ms
78 ms
127 ms
103 ms
Our browser made a total of 61 requests to load all elements on the main page. We found that 0% of them (0 request) were addressed to the original Cdn.strategyzer.com, 5% (3 requests) were made to Cdn.jsdelivr.net and 5% (3 requests) were made to Uploads-ssl.webflow.com. The less responsive or slowest element that took the longest time to load (1.7 sec) relates to the external source Strategyzer.com.
Page size can be reduced by 572.9 kB (9%)
6.6 MB
6.0 MB
In fact, the total size of Cdn.strategyzer.com main page is 6.6 MB. This result falls beyond the top 1M of websites and identifies a large and not optimized web page that may take ages to load. Only a small number of websites need less resources to load. Images take 5.6 MB which makes up the majority of the site volume.
Potential reduce by 399.5 kB
HTML content can be minified and compressed by a website’s server. The most efficient way is to compress content using GZIP which reduces data amount travelling through the network between server and browser. HTML code on this page is well minified. It is highly recommended that content of this web page should be compressed using GZIP, as it can save up to 399.5 kB or 67% of the original size.
Potential reduce by 166.1 kB
Image size optimization can help to speed up a website loading time. The chart above shows the difference between the size before and after optimization. Cdn Strategyzer images are well optimized though.
Potential reduce by 7.3 kB
It’s better to minify JavaScript in order to improve website performance. The diagram shows the current total size of all JavaScript files against the prospective JavaScript size after its minification and compression. This website has mostly compressed JavaScripts.
Potential reduce by 0 B
CSS files minification is very important to reduce a web page rendering time. The faster CSS files can load, the earlier a page can be rendered. Cdn.strategyzer.com has all CSS files already compressed.
Number of requests can be reduced by 15 (27%)
56
41
The browser has sent 56 CSS, Javascripts, AJAX and image requests in order to completely render the main page of Cdn Strategyzer. We recommend that multiple CSS and JavaScript files should be merged into one by each type, as it can help reduce assets requests from 16 to 1 for JavaScripts and as a result speed up the page load time.
strategyzer.com
333 ms
www.strategyzer.com
1694 ms
strategyzer-staging.webflow.4d48da702.min.css
78 ms
script.js
127 ms
scrolldisable.js
103 ms
v2.js
103 ms
jquery-3.5.1.min.dc5e7f18c8.js
62 ms
webflow.c0fa7ffe9.js
95 ms
swiper-bundle.min.js
91 ms
lenis.min.js
90 ms
4952096.js
85 ms
gtm.js
124 ms
lib.min.js
610 ms
6479a66e5f603149795c6a52_Nestle%20logo.svg
70 ms
65aa42ac3ddcc0abf6adcedd_pharma.svg
197 ms
64d5006e78bc9838711b8f8f_Logo.svg
194 ms
660c19d607398b875ad7ea2d_Logo%20ibl.webp
244 ms
64ca4a89a8a1cc3150658ccc_Property%201%3DMastercard.svg
221 ms
64ca4d633ebd11e3d84eec85_Property%201%3DSchreiber.svg
218 ms
64ca30e9cf08036ca8f5ed7f_Property%201%3DMSD.svg
220 ms
668276bdb88e1b5adc27b9cd_Lead%20innovate%20and%20grow%20with%20Ai%20and%20generative%20AI%20hero.png
254 ms
667be36b40f434043d5c3d7a_Thumb-Deep%20dive%20roi%20for%20innovation.png
221 ms
661d43aa56e7d3b94a39446c_April%202024-Your%20first%20100%20days%20on%20the%20innovation%20job-hero.webp
258 ms
664f123669b0fed871bcc900_AdobeStock_300144034.jpg
275 ms
6628e9877b6c9f486b1f1f8d_thumb-business%20models%20deep%20dive.png
262 ms
664dfa4823d26baf0cf3f4d5_webinar-platform.jpg
260 ms
66265eb23664a99009d90003_How%20to%20speed%20up%20innovation-hero.webp
269 ms
64c0d7e8cb8c04bb953fb5e1_VPC.webp
274 ms
64c0d7eaf6ee3f270cc99bdc_The%20VPC%20thumb.webp
278 ms
64c768f42320a46bf509705b_BMC.webp
279 ms
64c768e4e6ff9727eeacbf6e_The%20BMC%20thumb.webp
360 ms
6613ffb83c5f52711a7f3270_April%202024-Pharma%20challengesB.webp
361 ms
660bf5e7b39c56cefb89551c_Webinar%20recap_%20One-stop%20shop%20-hero.webp
362 ms
65eb2befb1ccde7a335ada8d_Webinar%20recap_%20SMEs%20-%20hero.webp
369 ms
66ac8c3e52f0802af5e7747e_Webinar-%20sept12-%20header.png
364 ms
66ac8c463b015bfe5c0130e0_Webinar-%20sept12-thumb.png
362 ms
667e63aaed3183f40c0b9bb3_with%20ai%20header%20photo.png
363 ms
64c90ca4c2df72efe9d5d4e9_hero_Testing.jpg
365 ms
64be6c432b96d0a39fa7ab14_testing%20business%20ideas.jpeg
366 ms
647dacd3750e3bbfe5055f0d_Avatar-5.png
364 ms
647dac90547c982b6aa7e3c9_Avatar-2.png
367 ms
647dac90840f30f9479251e3_Avatar-6.png
367 ms
647dac90102d54f8e72b5f5d_Avatar-3.png
368 ms
647dac9017a50da7a92710c5_Avatar-12.png
369 ms
647dac907cfd6c9c67242fd8_Avatar-7.png
369 ms
64afa99a7ac709727779e228_Avatar.png
371 ms
64afa938bdbaa98c245d7389_Avatar.png
371 ms
65a7db12fa399c36044db359_matt.png
371 ms
647dac90f932c383c000ac06_Avatar.png
371 ms
conversations-embed.js
264 ms
4952096.js
275 ms
fb.js
352 ms
banner.js
353 ms
web-interactives-embed.js
355 ms
leadflows.js
353 ms
647dac904930f7efb734cfb8_Avatar-10.png
364 ms
6476566bc9a714a44feb9af5_TWKEverett-Regular.otf
86 ms
6479f22439288397fee78f51_TWKEverett-Medium.otf
87 ms
6483430bd7febb7acffdbb17_TWKEverett-Bold.otf
87 ms
647dac9070e4e618fa52fbc8_Avatar-11.png
183 ms
647dac9084c7475a192c2c2c_Avatar-13.png
208 ms
cdn.strategyzer.com accessibility score
ARIA
These are opportunities to improve the usage of ARIA in your application which may enhance the experience for users of assistive technology, like a screen reader.
Impact
Issue
Elements with an ARIA [role] that require children to contain a specific [role] are missing some or all of those required children.
Contrast
These are opportunities to improve the legibility of your content.
Impact
Issue
Background and foreground colors do not have a sufficient contrast ratio.
Names and labels
These are opportunities to improve the semantics of the controls in your application. This may enhance the experience for users of assistive technology, like a screen reader.
Impact
Issue
Links do not have a discernible name
cdn.strategyzer.com best practices score
Trust and Safety
Impact
Issue
Does not use HTTPS
Ensure CSP is effective against XSS attacks
General
Impact
Issue
Detected JavaScript libraries
Browser errors were logged to the console
Missing source maps for large first-party JavaScript
cdn.strategyzer.com SEO score
Mobile Friendly
Make sure your pages are mobile friendly so users don’t have to pinch or zoom in order to read the content pages. [Learn more](https://developers.google.com/search/mobile-sites/).
Impact
Issue
Document uses legible font sizes
Tap targets are not sized appropriately
EN
EN
UTF-8
Language claimed in HTML meta tag should match the language actually used on the web page. Otherwise Cdn.strategyzer.com can be misinterpreted by Google and other search engines. Our service has detected that English is used on the page, and it matches the claimed language. Our system also found out that Cdn.strategyzer.com main page’s claimed encoding is utf-8. Use of this encoding format is the best practice as the main page visitors from all over the world won’t have any issues with symbol transcription.
cdn.strategyzer.com
Open Graph data is detected on the main page of Cdn Strategyzer. This is the best way to make the web page social media friendly. Here is how it looks like on Facebook: