2.7 sec in total
296 ms
1.7 sec
626 ms
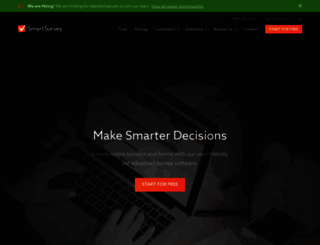
Visit reports.smartsurvey.co.uk now to see the best up-to-date Reports Smart Survey content for United Kingdom and also check out these interesting facts you probably never knew about reports.smartsurvey.co.uk
Create and distribute surveys with our user-friendly yet advanced online survey tool, then analyse results graphically. UK-based team.
Visit reports.smartsurvey.co.ukWe analyzed Reports.smartsurvey.co.uk page load time and found that the first response time was 296 ms and then it took 2.4 sec to load all DOM resources and completely render a web page. This is quite a good result, as only 45% of websites can load faster.
reports.smartsurvey.co.uk performance score
name
value
score
weighting
Value4.1 s
21/100
10%
Value13.0 s
0/100
25%
Value10.1 s
9/100
10%
Value2,150 ms
6/100
30%
Value0.088
93/100
15%
Value24.3 s
0/100
10%
296 ms
508 ms
529 ms
37 ms
36 ms
Our browser made a total of 82 requests to load all elements on the main page. We found that 2% of them (2 requests) were addressed to the original Reports.smartsurvey.co.uk, 80% (66 requests) were made to Cdn.prod.website-files.com and 6% (5 requests) were made to Fonts.gstatic.com. The less responsive or slowest element that took the longest time to load (529 ms) relates to the external source Smartsurvey.co.uk.
Page size can be reduced by 317.0 kB (24%)
1.3 MB
993.9 kB
In fact, the total size of Reports.smartsurvey.co.uk main page is 1.3 MB. This result falls beyond the top 1M of websites and identifies a large and not optimized web page that may take ages to load. Only a small number of websites need less resources to load. Images take 843.0 kB which makes up the majority of the site volume.
Potential reduce by 69.9 kB
HTML content can be minified and compressed by a website’s server. The most efficient way is to compress content using GZIP which reduces data amount travelling through the network between server and browser. HTML code on this page is well minified. It is highly recommended that content of this web page should be compressed using GZIP, as it can save up to 69.9 kB or 80% of the original size.
Potential reduce by 246.3 kB
Image size optimization can help to speed up a website loading time. The chart above shows the difference between the size before and after optimization. Obviously, Reports Smart Survey needs image optimization as it can save up to 246.3 kB or 29% of the original volume. The most popular and efficient tools for JPEG and PNG image optimization are Jpegoptim and PNG Crush.
Potential reduce by 764 B
It’s better to minify JavaScript in order to improve website performance. The diagram shows the current total size of all JavaScript files against the prospective JavaScript size after its minification and compression. This website has mostly compressed JavaScripts.
Potential reduce by 0 B
CSS files minification is very important to reduce a web page rendering time. The faster CSS files can load, the earlier a page can be rendered. Reports.smartsurvey.co.uk has all CSS files already compressed.
Number of requests can be reduced by 7 (10%)
67
60
The browser has sent 67 CSS, Javascripts, AJAX and image requests in order to completely render the main page of Reports Smart Survey. We recommend that multiple CSS and JavaScript files should be merged into one by each type, as it can help reduce assets requests from 8 to 1 for JavaScripts and as a result speed up the page load time.
reports.smartsurvey.co.uk
296 ms
reports.smartsurvey.co.uk
508 ms
www.smartsurvey.co.uk
529 ms
smartsurvey.webflow.2f38a7ad1.min.css
37 ms
webfont.js
36 ms
banner.js
35 ms
v2.js
68 ms
jquery-3.5.1.min.dc5e7f18c8.js
24 ms
webflow.f48788157.js
44 ms
css
40 ms
loader.js
114 ms
gtm.js
118 ms
66b62d0e3a32f0193c7fb61e_logo-smartsurvey-primary-rgb.svg
28 ms
6495c51854f5fb7b5707b478_Frame%2045.svg
94 ms
6495c59f8560288d4658c4c9_Frame%2045%20(1).svg
93 ms
6644c6a440ef2db5f512d409_nav-dd-dashboards.svg
111 ms
63ed0db15a2a096fbacdebc7_header-homepage-1.svg
120 ms
63ed1143ed7729409a66b581_barclays-ar21.svg
119 ms
63ed1771734cb371a7e21f3f_Microsoft_logo.svg
131 ms
63ed1364c79b1852b0ac743f_nhs-logo.svg
113 ms
63ed14e52e22041950aa632e_environment-agency-logo.svg
119 ms
64de4517291b2057971ae8b1_logo-aldi.svg
132 ms
64de45588f29e2e3c6489903_logo-ofsted.svg
134 ms
63ed15c244cf1b2a636c898b_vodafone-logo.svg
151 ms
66759ede5b502665983d999a_explore-ss.png
155 ms
66b394220a5d0e3228ac6a46_logo-product-ss.svg
149 ms
66759f1b56805f825ff6593a_explore-cx.png
153 ms
66b39422775f4fc4beb5d321_logo-product-cx.svg
151 ms
66759f33ab53187eef5a427a_explore-ex.png
152 ms
66b394228b5a0bea135ba891_logo-product-ex.svg
168 ms
66759f501c856ee00e695b97_explore-ce.png
182 ms
66b3942208e9863028195e84_logo-product-ce.svg
171 ms
66759f766e183e2165acd718_explore-px.png
169 ms
66b394225773afcbd8ddcf54_logo-product-px.svg
170 ms
66b36134325b88876fdad5dd_icon-ss.svg
172 ms
66b3613423991e3fbf07c7db_icon-cx.svg
174 ms
66b3613450ec76543c47825a_icon-ex.svg
172 ms
66b361347e5f230600b2469c_icon-ce.svg
175 ms
66b36134c377ba3565853260_icon-px.svg
180 ms
63ee607d286d7004bd69a300_upscaled-banner-left.webp
182 ms
6447ec0955b1e3e16f03b567_flag_gb.png
182 ms
63ee634d914ca245bff76198_hands-icon.svg
185 ms
6492c8bd2c27d25d876bdff3_safe-hands.png
183 ms
63eea1649702e9174bb84b58_image-square.webp
184 ms
66045b480d2c120191f27649_logo-gmc.png
183 ms
63ee6518a40ffd66d57ed702_%E2%80%9C.svg
186 ms
651400856a31e49210994af6_card-logo-aldi.svg
186 ms
63ee6518a40ffdf4b27ed6fc_Frame%2027.svg
188 ms
63ee6518a40ffd171e7ed6f9_Frame%2028.svg
197 ms
KFOOCniXp96a4Tc2DaTeuDAoKsE617JFc49knOIYdjTYkqUcKWmQ.woff
47 ms
KFOOCniXp96a4Tc2DaTeuDAoKsE617JFc49knOIYdjTYoKUcKWmQ.woff
46 ms
KFOOCniXp96a4Tc2DaTeuDAoKsE617JFc49knOIYdjTYTKIcKWmQ.woff
61 ms
KFOOCniXp96a4Tc2DaTeuDAoKsE617JFc49knOIYdjTYdaIcKWmQ.woff
65 ms
KFOOCniXp96a4Tc2DaTeuDAoKsE617JFc49knOIYdjTYEqIcKWmQ.woff
66 ms
call-tracking_9.js
20 ms
6655bbe1dbb7f25456cd20b0_Inter-SemiBold.ttf
106 ms
6655bbe0532d1f1e1f9efadb_Inter-ExtraBold.ttf
154 ms
6655bbe0ed4c7305392b9de7_Inter-Regular.ttf
90 ms
64022b5cb7ff575513c4dc9f_fa-regular-400.ttf
132 ms
6655bbe10a4688026d862a23_Inter-Italic.ttf
130 ms
6655bbe15ce5d6d61f49fe0f_Inter-SemiBoldItalic.ttf
123 ms
6655bbe0d2986307c17c0340_Inter-ExtraBoldItalic.ttf
124 ms
63ee6518a40ffdca1c7ed6fd_Frame%2026.webp
117 ms
63ee6518a40ffd4eb07ed6f8_uswitch%201.svg
117 ms
63ed20eed78696e35ea96d1c_green-arrow.svg
120 ms
63ee6518a40ffd0d277ed703_Frame%2030.svg
102 ms
63ee6518a40ffd10b17ed704_Frame%2031.svg
103 ms
63ee6518a40ffd51c97ed6fb_Frame%2023.svg
107 ms
63ee6518a40ffdaaef7ed701_Frame%2022.svg
104 ms
64ccd7c03afd959b043d1f57_icon-award2.svg
104 ms
6667124c97c310acb8326f66_crozdesk-trusted-vendor-2024.png
106 ms
6667124cd904f4b33d3c4def_crozdesk-happiest-users-2024.png
90 ms
6667124a7ade640db239b759_Survey_HighPerformer_EMEA_HighPerformer.png
90 ms
6667124a24847f654ff76456_Survey_HighPerformer_Small-Business_UnitedKingdom_HighPerformer.png
90 ms
66671630b75fe3266b95ddae_capterra-best-value.png
89 ms
6667163030e1acbd21af769f_capterra-ease-of-use.png
87 ms
66671630e42ffa827f3186a8_software-advice-most-recommended.png
88 ms
66671630f64ff54a955db75f_software-advice-customer-support.png
87 ms
63ecf8f19cf1aa12efadcdd7_logo.svg
84 ms
63ee70c966bf965a0905a5d8_Facebook.svg
110 ms
63ee70c966bf9634be05a5db_twitter.svg
108 ms
63ee70c966bf969aea05a5d9_Linkdin.svg
111 ms
reports.smartsurvey.co.uk accessibility score
Contrast
These are opportunities to improve the legibility of your content.
Impact
Issue
Background and foreground colors do not have a sufficient contrast ratio.
Navigation
These are opportunities to improve keyboard navigation in your application.
Impact
Issue
Heading elements are not in a sequentially-descending order
reports.smartsurvey.co.uk best practices score
Trust and Safety
Impact
Issue
Does not use HTTPS
Ensure CSP is effective against XSS attacks
General
Impact
Issue
Detected JavaScript libraries
Browser errors were logged to the console
Missing source maps for large first-party JavaScript
reports.smartsurvey.co.uk SEO score
Content Best Practices
Format your HTML in a way that enables crawlers to better understand your app’s content.
Impact
Issue
Links do not have descriptive text
Mobile Friendly
Make sure your pages are mobile friendly so users don’t have to pinch or zoom in order to read the content pages. [Learn more](https://developers.google.com/search/mobile-sites/).
Impact
Issue
Document uses legible font sizes
Tap targets are not sized appropriately
EN
EN
UTF-8
Language claimed in HTML meta tag should match the language actually used on the web page. Otherwise Reports.smartsurvey.co.uk can be misinterpreted by Google and other search engines. Our service has detected that English is used on the page, and it matches the claimed language. Our system also found out that Reports.smartsurvey.co.uk main page’s claimed encoding is utf-8. Use of this encoding format is the best practice as the main page visitors from all over the world won’t have any issues with symbol transcription.
reports.smartsurvey.co.uk
Open Graph data is detected on the main page of Reports Smart Survey. This is the best way to make the web page social media friendly. Here is how it looks like on Facebook: