Report Summary

  • 64

    Performance

    Renders faster than
    78% of other websites

  • 84

    Accessibility

    Visual factors better than
    that of 57% of websites

  • 75

    Best Practices

    More advanced features
    available than in
    36% of websites

  • 100

    SEO

    Google-friendlier than
    95% of websites

scholarscentral.org

Submission and Review Tracking System | Scholars Central

Page Load Speed

1.5 sec in total

First Response

496 ms

Resources Loaded

854 ms

Page Rendered

138 ms

scholarscentral.org screenshot

About Website

Welcome to scholarscentral.org homepage info - get ready to check Scholars Central best content for Ethiopia right away, or after learning these important things about scholarscentral.org

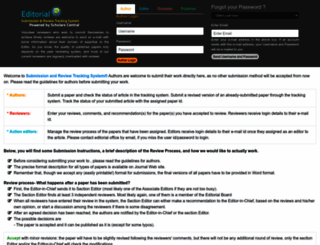
Submission and Review Tracking System was founded with a mission to provide free access to scientific literature for quick dissemination of scientific updates and to provide a source of reference and ...

Visit scholarscentral.org

Key Findings

We analyzed Scholarscentral.org page load time and found that the first response time was 496 ms and then it took 992 ms to load all DOM resources and completely render a web page. This is quite a good result, as only 20% of websites can load faster.

Performance Metrics

scholarscentral.org performance score

64

Measured Metrics

name

value

score

weighting

FCP (First Contentful Paint)

Value4.0 s

23/100

10%

LCP (Largest Contentful Paint)

Value4.9 s

29/100

25%

SI (Speed Index)

Value8.4 s

19/100

10%

TBT (Total Blocking Time)

Value30 ms

100/100

30%

CLS (Cumulative Layout Shift)

Value0.002

100/100

15%

TTI (Time to Interactive)

Value5.0 s

77/100

10%

Network Requests Diagram

scholarscentral.org

496 ms

jquery.min.js

332 ms

expstickybar.css

143 ms

style.css

164 ms

slide.css

175 ms

Our browser made a total of 27 requests to load all elements on the main page. We found that 93% of them (25 requests) were addressed to the original Scholarscentral.org, 7% (2 requests) were made to Google-analytics.com. The less responsive or slowest element that took the longest time to load (496 ms) belongs to the original domain Scholarscentral.org.

Page Optimization Overview & Recommendations

Page size can be reduced by 209.1 kB (60%)

Content Size

348.7 kB

After Optimization

139.6 kB

In fact, the total size of Scholarscentral.org main page is 348.7 kB. This result falls beyond the top 1M of websites and identifies a large and not optimized web page that may take ages to load. 15% of websites need less resources to load. Javascripts take 210.1 kB which makes up the majority of the site volume.

HTML Optimization

-82%

Potential reduce by 54.6 kB

  • Original 66.8 kB
  • After minification 56.0 kB
  • After compression 12.2 kB

HTML content can be minified and compressed by a website’s server. The most efficient way is to compress content using GZIP which reduces data amount travelling through the network between server and browser. This page needs HTML code to be minified as it can gain 10.8 kB, which is 16% of the original size. It is highly recommended that content of this web page should be compressed using GZIP, as it can save up to 54.6 kB or 82% of the original size.

Image Optimization

-2%

Potential reduce by 779 B

  • Original 50.3 kB
  • After minification 49.5 kB

Image size optimization can help to speed up a website loading time. The chart above shows the difference between the size before and after optimization. Scholars Central images are well optimized though.

JavaScript Optimization

-65%

Potential reduce by 136.0 kB

  • Original 210.1 kB
  • After minification 207.2 kB
  • After compression 74.1 kB

It’s better to minify JavaScript in order to improve website performance. The diagram shows the current total size of all JavaScript files against the prospective JavaScript size after its minification and compression. It is highly recommended that all JavaScript files should be compressed and minified as it can save up to 136.0 kB or 65% of the original size.

CSS Optimization

-82%

Potential reduce by 17.7 kB

  • Original 21.5 kB
  • After minification 16.2 kB
  • After compression 3.8 kB

CSS files minification is very important to reduce a web page rendering time. The faster CSS files can load, the earlier a page can be rendered. Scholarscentral.org needs all CSS files to be minified and compressed as it can save up to 17.7 kB or 82% of the original size.

Requests Breakdown

Number of requests can be reduced by 10 (38%)

Requests Now

26

After Optimization

16

The browser has sent 26 CSS, Javascripts, AJAX and image requests in order to completely render the main page of Scholars Central. We recommend that multiple CSS and JavaScript files should be merged into one by each type, as it can help reduce assets requests from 7 to 1 for JavaScripts and from 5 to 1 for CSS and as a result speed up the page load time.

Accessibility Review

scholarscentral.org accessibility score

84

Accessibility Issues

ARIA

These are opportunities to improve the usage of ARIA in your application which may enhance the experience for users of assistive technology, like a screen reader.

Impact

Issue

High

Elements with an ARIA [role] that require children to contain a specific [role] are missing some or all of those required children.

High

[role]s are not contained by their required parent element

Contrast

These are opportunities to improve the legibility of your content.

Impact

Issue

High

Background and foreground colors do not have a sufficient contrast ratio.

Tables and lists

These are opportunities to improve the experience of reading tabular or list data using assistive technology, like a screen reader.

Impact

Issue

High

List items (<li>) are not contained within <ul> or <ol> parent elements.

Best Practices

scholarscentral.org best practices score

75

Areas of Improvement

Trust and Safety

Impact

Issue

High

Does not use HTTPS

High

Includes front-end JavaScript libraries with known security vulnerabilities

Low

Ensure CSP is effective against XSS attacks

General

Impact

Issue

Low

Detected JavaScript libraries

High

Browser errors were logged to the console

High

Page has valid source maps

SEO Factors

scholarscentral.org SEO score

100

Search Engine Optimization Advices

Mobile Friendly

Make sure your pages are mobile friendly so users don’t have to pinch or zoom in order to read the content pages. [Learn more](https://developers.google.com/search/mobile-sites/).

Impact

Issue

High

Document uses legible font sizes

Language and Encoding

  • Language Detected

    EN

  • Language Claimed

    EN

  • Encoding

    N/A

Language claimed in HTML meta tag should match the language actually used on the web page. Otherwise Scholarscentral.org can be misinterpreted by Google and other search engines. Our service has detected that English is used on the page, and it matches the claimed language. Our system also found out that Scholarscentral.org main page’s claimed encoding is . Changing it to UTF-8 can be a good choice, as this format is commonly used for encoding all over the web and thus their visitors won’t have any troubles with symbol transcription or reading.

Social Sharing Optimization

Open Graph description is not detected on the main page of Scholars Central. Lack of Open Graph description can be counter-productive for their social media presence, as such a description allows converting a website homepage (or other pages) into good-looking, rich and well-structured posts, when it is being shared on Facebook and other social media. For example, adding the following code snippet into HTML <head> tag will help to represent this web page correctly in social networks: