7.1 sec in total
83 ms
5.7 sec
1.4 sec
Visit sparkchart.com now to see the best up-to-date Sparkchart content for Australia and also check out these interesting facts you probably never knew about sparkchart.com
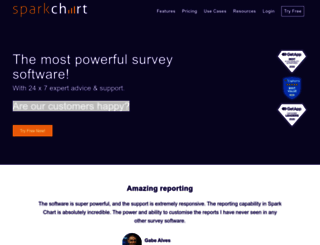
Survey software tool to build custom brand surveys & get powerful reports & analytics instantly. Get the feedback you need to succeed.
Visit sparkchart.comWe analyzed Sparkchart.com page load time and found that the first response time was 83 ms and then it took 7 sec to load all DOM resources and completely render a web page. This is a poor result, as 80% of websites can load faster.
sparkchart.com performance score
name
value
score
weighting
Value3.5 s
35/100
10%
Value5.1 s
24/100
25%
Value5.1 s
62/100
10%
Value300 ms
79/100
30%
Value0.011
100/100
15%
Value7.5 s
47/100
10%
83 ms
460 ms
73 ms
163 ms
194 ms
Our browser made a total of 145 requests to load all elements on the main page. We found that 2% of them (3 requests) were addressed to the original Sparkchart.com, 38% (55 requests) were made to View.sparkchart.com and 14% (20 requests) were made to Website-16637.kxcdn.com. The less responsive or slowest element that took the longest time to load (2.4 sec) relates to the external source Survey.sparkchart.com.
Page size can be reduced by 376.0 kB (42%)
898.8 kB
522.8 kB
In fact, the total size of Sparkchart.com main page is 898.8 kB. This result falls beyond the top 1M of websites and identifies a large and not optimized web page that may take ages to load. Only a small number of websites need less resources to load. Javascripts take 577.4 kB which makes up the majority of the site volume.
Potential reduce by 109.9 kB
HTML content can be minified and compressed by a website’s server. The most efficient way is to compress content using GZIP which reduces data amount travelling through the network between server and browser. HTML code on this page is well minified. It is highly recommended that content of this web page should be compressed using GZIP, as it can save up to 109.9 kB or 80% of the original size.
Potential reduce by 4.2 kB
Image size optimization can help to speed up a website loading time. The chart above shows the difference between the size before and after optimization. Sparkchart images are well optimized though.
Potential reduce by 261.9 kB
It’s better to minify JavaScript in order to improve website performance. The diagram shows the current total size of all JavaScript files against the prospective JavaScript size after its minification and compression. It is highly recommended that all JavaScript files should be compressed and minified as it can save up to 261.9 kB or 45% of the original size.
Potential reduce by 0 B
CSS files minification is very important to reduce a web page rendering time. The faster CSS files can load, the earlier a page can be rendered. Sparkchart.com has all CSS files already compressed.
Number of requests can be reduced by 106 (80%)
132
26
The browser has sent 132 CSS, Javascripts, AJAX and image requests in order to completely render the main page of Sparkchart. We recommend that multiple CSS and JavaScript files should be merged into one by each type, as it can help reduce assets requests from 74 to 1 for JavaScripts and from 34 to 1 for CSS and as a result speed up the page load time.
sparkchart.com
83 ms
www.sparkchart.com
460 ms
js
73 ms
style.min.css
163 ms
widget-options.css
194 ms
avia-merged-styles-6289b436232dd7615851abc1c80c9c99---66cbe817389db.css
286 ms
post-9423.css
257 ms
jquery.min.js
307 ms
frontend-gtag.min.js
258 ms
js.cookie.js
258 ms
handl-utm-grabber.js
259 ms
avia-head-scripts-7d59f333acd53706b93ce441ba862aeb---66cbe8174a927.js
315 ms
101206505.js
34 ms
underscore.min.js
318 ms
core.min.js
319 ms
dotlottie-player.js
407 ms
avia-footer-scripts-056995bab5bc5791593c43df95d06ee8---66cbe817ba932.js
407 ms
lazyload.min.js
401 ms
widget.getgist.com
119 ms
sparkchart-logo-2-300x71.png
92 ms
sparkchart-logo-2.png
92 ms
Gabe-Alves-180x180.jpg
89 ms
Dylan-Forbes-1.jpg
92 ms
Kyle-Malone-180x180.jpg
116 ms
Call-To-Action-2.png
151 ms
entypo-fontello.woff
57 ms
gist-9a125c843b.min.js
52 ms
701 ms
1020 ms
in.php
104 ms
css
45 ms
bootstrap.min.css
31 ms
icheck_custom_all.min.css
41 ms
froala_style.min.css
42 ms
bootstrap-select.min.css
45 ms
sparq-runtime-icons.css
69 ms
components_plugins.min.css
113 ms
custom_user_participant.min.css
83 ms
thirdparty.css
82 ms
layouts.css
97 ms
widget.js
171 ms
css2
61 ms
jquery.min.js
49 ms
bootstrap.min.js
50 ms
jquery.blockUI.min.js
50 ms
js.cookie.min.js
56 ms
twitter-bootstrap-hover-dropdown.min.js
47 ms
icheck.min.js
108 ms
base64.min.js
108 ms
bootstrap-select.min.js
51 ms
index.js
128 ms
js
56 ms
prrbcg89gb5jfrknyhuy6evwx8yzc2ks2naxs95kt32znp73rp_s.png
131 ms
widget_app_1724849559553.js
26 ms
84c3d1ad23e6831d5f5d6c744a949ee6_6459936234bd03.80473076.png
127 ms
font
23 ms
nVQKrQgaTl
408 ms
datatables.css
51 ms
grey.css
76 ms
blue.css
77 ms
select2.css
78 ms
select2-bootstrap.min.css
80 ms
bootstrap-select.min.css
79 ms
multi-select.css
81 ms
sparks.min.css
104 ms
daterangepicker.css
106 ms
all.min.css
140 ms
v4-shims.css
107 ms
sparq-icons.min.css
109 ms
components.min.css
145 ms
plugins.min.css
131 ms
layout.min.css
136 ms
grey.min.css
133 ms
style.css
135 ms
ui_common.min.css
186 ms
view.min.css
160 ms
css2
32 ms
jquery-1.12.1.min.js
254 ms
jquery.uniform.min.js
18 ms
toastr.min.js
135 ms
base64.min.js
137 ms
moment.min.js
153 ms
datatables.min.js
288 ms
datetime-moment.js
253 ms
bootbox.min.js
253 ms
icheck.min.js
286 ms
amcharts.js
17 ms
serial.js
14 ms
pie.js
22 ms
funnel.js
10 ms
gauge.js
16 ms
light.js
20 ms
dark.js
29 ms
core.js
316 ms
charts.js
296 ms
animated.js
286 ms
wordCloud.js
286 ms
select2.full.min.js
285 ms
bootstrap-select.min.js
296 ms
jquery.multi-select.js
296 ms
jquery.blockui.min.js
296 ms
c0afbf241293ed3674d819c03d93d393_6517bd50297240.88652679.png
29 ms
moment.min.js
296 ms
daterangepicker.js
293 ms
page-notifications.js
269 ms
config.js
266 ms
app.min.js
269 ms
layout.min.js
294 ms
global.js
294 ms
tracking.js
294 ms
page-list-datatable.js
270 ms
modal-core.js
271 ms
index.js
267 ms
index.js
290 ms
index-charts.js
269 ms
sparkchart-ui.js
269 ms
survey-response-file-downloader.js
267 ms
1895 ms
sparq-icons.ttf
73 ms
fa-light-300.woff
180 ms
fa-regular-400.woff
181 ms
fa-solid-900.woff
182 ms
en-US.json
56 ms
analytics.js
134 ms
collect
13 ms
js
47 ms
remediation-tool-free.js
7 ms
body_wh.svg
10 ms
spin_wh.svg
16 ms
2360 ms
css2
29 ms
34d7fa95f364da07f36d0ba4b6a0c79e_645988bc8d41b1.18233796.png
104 ms
index.js
50 ms
sparq-runtime-icons.ttf
34 ms
nVQKrQgaTl
144 ms
css2
30 ms
IeegZ2r4htU
112 ms
sparkchart_logo_b_w100.png
37 ms
nVQKrQgaTl
336 ms
www-player.css
8 ms
www-embed-player.js
24 ms
base.js
56 ms
ad_status.js
133 ms
6G8W4755DcKllowajy4Hir2nUkhKuKJIeeFduDotaQ8.js
85 ms
embed.js
25 ms
sparkchart.com accessibility score
Contrast
These are opportunities to improve the legibility of your content.
Impact
Issue
Background and foreground colors do not have a sufficient contrast ratio.
Navigation
These are opportunities to improve keyboard navigation in your application.
Impact
Issue
Heading elements are not in a sequentially-descending order
sparkchart.com best practices score
Trust and Safety
Impact
Issue
Does not use HTTPS
Ensure CSP is effective against XSS attacks
User Experience
Impact
Issue
Serves images with low resolution
General
Impact
Issue
Detected JavaScript libraries
Browser errors were logged to the console
sparkchart.com SEO score
Crawling and Indexing
To appear in search results, crawlers need access to your app.
Impact
Issue
robots.txt is not valid
Mobile Friendly
Make sure your pages are mobile friendly so users don’t have to pinch or zoom in order to read the content pages. [Learn more](https://developers.google.com/search/mobile-sites/).
Impact
Issue
Document uses legible font sizes
Tap targets are not sized appropriately
EN
EN
UTF-8
Language claimed in HTML meta tag should match the language actually used on the web page. Otherwise Sparkchart.com can be misinterpreted by Google and other search engines. Our service has detected that English is used on the page, and it matches the claimed language. Our system also found out that Sparkchart.com main page’s claimed encoding is utf-8. Use of this encoding format is the best practice as the main page visitors from all over the world won’t have any issues with symbol transcription.
sparkchart.com
Open Graph data is detected on the main page of Sparkchart. This is the best way to make the web page social media friendly. Here is how it looks like on Facebook: