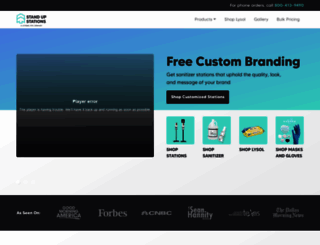
7.6 sec in total
137 ms
4.8 sec
2.7 sec
Click here to check amazing Stand Up Stations content for United States. Otherwise, check out these important facts you probably never knew about standupstations.com
Protect your employees and customers with premium custom-branded stands, refillable dispensers, and Hospital-Grade Sanitizer.
Visit standupstations.comWe analyzed Standupstations.com page load time and found that the first response time was 137 ms and then it took 7.5 sec to load all DOM resources and completely render a web page. This is a poor result, as 85% of websites can load faster.
standupstations.com performance score
137 ms
922 ms
223 ms
278 ms
160 ms
Our browser made a total of 139 requests to load all elements on the main page. We found that 32% of them (44 requests) were addressed to the original Standupstations.com, 14% (19 requests) were made to C0.wp.com and 9% (13 requests) were made to I2.wp.com. The less responsive or slowest element that took the longest time to load (2.7 sec) relates to the external source I1.wp.com.
Page size can be reduced by 435.9 kB (21%)
2.1 MB
1.6 MB
In fact, the total size of Standupstations.com main page is 2.1 MB. This result falls beyond the top 1M of websites and identifies a large and not optimized web page that may take ages to load. 80% of websites need less resources to load and that’s why Accessify’s recommendations for optimization and resource minification can be helpful for this project. Images take 1.6 MB which makes up the majority of the site volume.
Potential reduce by 115.1 kB
HTML content can be minified and compressed by a website’s server. The most efficient way is to compress content using GZIP which reduces data amount travelling through the network between server and browser. HTML code on this page is well minified. It is highly recommended that content of this web page should be compressed using GZIP, as it can save up to 115.1 kB or 82% of the original size.
Potential reduce by 314.3 kB
Image size optimization can help to speed up a website loading time. The chart above shows the difference between the size before and after optimization. Obviously, Stand Up Stations needs image optimization as it can save up to 314.3 kB or 20% of the original volume. The most popular and efficient tools for JPEG and PNG image optimization are Jpegoptim and PNG Crush.
Potential reduce by 4.0 kB
It’s better to minify JavaScript in order to improve website performance. The diagram shows the current total size of all JavaScript files against the prospective JavaScript size after its minification and compression. This website has mostly compressed JavaScripts.
Potential reduce by 2.5 kB
CSS files minification is very important to reduce a web page rendering time. The faster CSS files can load, the earlier a page can be rendered. Standupstations.com has all CSS files already compressed.
Number of requests can be reduced by 77 (60%)
129
52
The browser has sent 129 CSS, Javascripts, AJAX and image requests in order to completely render the main page of Stand Up Stations. We recommend that multiple CSS and JavaScript files should be merged into one by each type, as it can help reduce assets requests from 57 to 1 for JavaScripts and from 22 to 1 for CSS and as a result speed up the page load time.
standupstations.com
137 ms
standupstations.com
922 ms
js
223 ms
182Qe4GHjPw4pwKlNJ9s
278 ms
wp-emoji-release.min.js
160 ms
style.min.css
206 ms
mediaelementplayer-legacy.min.css
230 ms
wp-mediaelement.min.css
211 ms
vendors-style.css
228 ms
style.css
210 ms
forms.min.css
197 ms
styles.css
198 ms
sweetalert2.min.css
349 ms
style.css
370 ms
woocommerce_one_click_upsell_funnel_pro-public.css
235 ms
woocommerce-layout.css
227 ms
woocommerce.css
239 ms
front.min.css
233 ms
customize-table.css
233 ms
woocommerce.css
231 ms
slick.css
232 ms
slick-theme.min.css
242 ms
stand-up.min.css
260 ms
awdr_style.css
298 ms
jetpack.css
242 ms
jquery.min.js
246 ms
jquery-migrate.min.js
248 ms
fp-rac-guest-checkout.js
257 ms
sweetalert2.min.js
257 ms
polyfill.min.js
316 ms
jquery.cookie.min.js
246 ms
tracking.min.js
317 ms
site_main.js
314 ms
awdr-dynamic-price.js
317 ms
s-202241.js
243 ms
awdr_pro.js
318 ms
klaviyo.js
209 ms
photon.min.js
241 ms
regenerator-runtime.min.js
242 ms
wp-polyfill.min.js
244 ms
index.js
314 ms
index.js
315 ms
woocommerce-oneclick-upsell-funnel-public.js
314 ms
jquery.blockUI.min.js
241 ms
add-to-cart.min.js
243 ms
js.cookie.min.js
243 ms
woocommerce.min.js
243 ms
slick.min.js
248 ms
popper.min.js
315 ms
bootstrap.min.js
331 ms
intersection-observer.js
315 ms
lazy-images.js
315 ms
kl-identify-browser.js
329 ms
api.js
237 ms
index.js
334 ms
stand-up.min.js
330 ms
e-202241.js
219 ms
conversion_async.js
155 ms
loader.js
143 ms
woocommerce-smallscreen.css
45 ms
call-tracking_7.js
19 ms
548 ms
analytics.js
729 ms
sw.js
775 ms
fbevents.js
673 ms
sdk.js
1075 ms
688871077
1131 ms
custom-hand-sanitizer-stations.png
1146 ms
gma-e1592510791252.png
772 ms
cnbc.png
763 ms
dispensers.png
743 ms
custom-branding.png
1236 ms
140-1409995_courtyard-by-marriott-logo-png-transparent-courtyard-marriott.png
1064 ms
cbre.png
752 ms
pure-barre-logo-white-750px-ohrsizvwhbrz7oc6gwcg3kgbly739x741uhsq8sj5s.png
750 ms
sus-citadel.png
489 ms
stations.png
489 ms
sanitizer.png
623 ms
lysol.png
624 ms
img-3.png
722 ms
SUS-Icon-Primary.svg
488 ms
gel.svg
594 ms
liquid.svg
595 ms
forbes-logo-black-transparent.png
747 ms
The_Sean_Hannity_Show_logo.svg.png
748 ms
gmt.png
747 ms
sanitizer-white-bg.jpg
737 ms
blue-honda-logo-png.png
748 ms
hrblock.png
765 ms
hampton-inn.png
1115 ms
hgi_color_HR.png
1066 ms
tcu.png
1064 ms
the-salvation-army-logo-png-transparent.png
1228 ms
sanitizer-modal-block.png
1045 ms
sus-custom-branding-2.png
1043 ms
sus-sanitizer-hero-slide.png
2746 ms
vippng.com-morning-png-4290805.png
735 ms
custom-hand-sanitizer-stations.png
744 ms
lobby-2048x1364-1.jpg
763 ms
1280px-NASA_Worm_logo.svg.png
734 ms
nordstrom.png
1058 ms
DD_black.png
1064 ms
1280px-Cushman__Wakefield_logo.svg.png
1058 ms
chevy.png
1060 ms
jll_logo.png
1124 ms
KIA_logo2.svg.png
1114 ms
legends-bank.png
1112 ms
inspectlet.js
740 ms
bat.js
628 ms
insight.min.js
637 ms
recaptcha__en.js
545 ms
update.min.js
661 ms
wcm
155 ms
made_tommy_soft_regular.woff
316 ms
made_tommy_soft_light.woff
638 ms
made_tommy_soft_bold.woff
639 ms
fa-regular-400.woff
791 ms
fa-solid-900.woff
790 ms
fa-brands-400.woff
783 ms
214 ms
identity.js
79 ms
2577405855816461
434 ms
collect
337 ms
56126064.js
303 ms
cq_blank.gif
201 ms
sw_connect.js
401 ms
collect
1148 ms
player.js
483 ms
player.css
385 ms
vuid.min.js
337 ms
1791061357
1006 ms
main.Mi4wLjAuNTZfMA.js
267 ms
update.show.min.js
192 ms
56126064
888 ms
i.png
891 ms
1395144669-c5fcd4b369e7b15e43d89d065a263337cc9368dd26fdc4cd18e80032d32e4358-d
867 ms
clarity.js
92 ms
28 ms
c.gif
57 ms
standupstations.com SEO score
EN
EN
UTF-8
Language claimed in HTML meta tag should match the language actually used on the web page. Otherwise Standupstations.com can be misinterpreted by Google and other search engines. Our service has detected that English is used on the page, and it matches the claimed language. Our system also found out that Standupstations.com main page’s claimed encoding is utf-8. Use of this encoding format is the best practice as the main page visitors from all over the world won’t have any issues with symbol transcription.
standupstations.com
Open Graph data is detected on the main page of Stand Up Stations. This is the best way to make the web page social media friendly. Here is how it looks like on Facebook: