8.8 sec in total
410 ms
6 sec
2.4 sec
Visit viability.io now to see the best up-to-date Viability content and also check out these interesting facts you probably never knew about viability.io
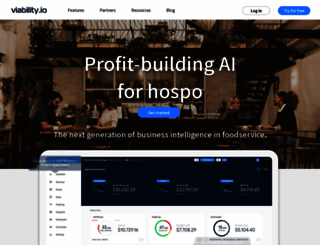
Boost profitability and future-proof your hospitality business with AI-driven rostering, ordering, and forecasting software by Viability.io. Start for free today!
Visit viability.ioWe analyzed Viability.io page load time and found that the first response time was 410 ms and then it took 8.4 sec to load all DOM resources and completely render a web page. This is a poor result, as 85% of websites can load faster.
viability.io performance score
name
value
score
weighting
Value4.7 s
13/100
10%
Value10.7 s
0/100
25%
Value12.6 s
3/100
10%
Value700 ms
43/100
30%
Value0.481
17/100
15%
Value13.6 s
11/100
10%
410 ms
1028 ms
56 ms
206 ms
408 ms
Our browser made a total of 120 requests to load all elements on the main page. We found that 93% of them (111 requests) were addressed to the original Viability.io, 6% (7 requests) were made to Fonts.gstatic.com and 1% (1 request) were made to Googletagmanager.com. The less responsive or slowest element that took the longest time to load (1.9 sec) belongs to the original domain Viability.io.
Page size can be reduced by 509.6 kB (20%)
2.6 MB
2.1 MB
In fact, the total size of Viability.io main page is 2.6 MB. This result falls beyond the top 1M of websites and identifies a large and not optimized web page that may take ages to load. 65% of websites need less resources to load. Images take 1.7 MB which makes up the majority of the site volume.
Potential reduce by 208.3 kB
HTML content can be minified and compressed by a website’s server. The most efficient way is to compress content using GZIP which reduces data amount travelling through the network between server and browser. HTML code on this page is well minified. It is highly recommended that content of this web page should be compressed using GZIP, as it can save up to 208.3 kB or 84% of the original size.
Potential reduce by 104.2 kB
Image size optimization can help to speed up a website loading time. The chart above shows the difference between the size before and after optimization. Viability images are well optimized though.
Potential reduce by 385 B
It’s better to minify JavaScript in order to improve website performance. The diagram shows the current total size of all JavaScript files against the prospective JavaScript size after its minification and compression. This website has mostly compressed JavaScripts.
Potential reduce by 196.8 kB
CSS files minification is very important to reduce a web page rendering time. The faster CSS files can load, the earlier a page can be rendered. Viability.io needs all CSS files to be minified and compressed as it can save up to 196.8 kB or 53% of the original size.
Number of requests can be reduced by 57 (51%)
111
54
The browser has sent 111 CSS, Javascripts, AJAX and image requests in order to completely render the main page of Viability. We recommend that multiple CSS and JavaScript files should be merged into one by each type, as it can help reduce assets requests from 32 to 1 for JavaScripts and from 18 to 1 for CSS and as a result speed up the page load time.
viability.io
410 ms
viability.io
1028 ms
gtm.js
56 ms
style.min.css
206 ms
theme.min.css
408 ms
header-footer.min.css
608 ms
frontend.min.css
815 ms
swiper.min.css
614 ms
post-200.css
640 ms
frontend.min.css
623 ms
uael-frontend.min.css
1035 ms
post-7.css
1012 ms
post-170.css
819 ms
post-193.css
824 ms
style.css
825 ms
css
31 ms
jquery.min.js
1221 ms
jquery-migrate.min.js
1020 ms
swiper.min.js
1029 ms
index.js
1031 ms
calculator.css
1213 ms
animations.min.css
1369 ms
basic.min.css
1369 ms
theme-ie11.min.css
1370 ms
theme.min.css
1422 ms
jquery.sticky.min.js
1476 ms
jquery.smartmenus.min.js
1475 ms
lottie.min.js
1674 ms
uael-frontend.min.js
1495 ms
typed.min.js
1495 ms
rvticker.min.js
1614 ms
imagesloaded.min.js
1690 ms
wp-polyfill-inert.min.js
1689 ms
regenerator-runtime.min.js
1690 ms
wp-polyfill.min.js
1690 ms
dom-ready.min.js
1815 ms
hooks.min.js
1876 ms
i18n.min.js
1878 ms
a11y.min.js
1878 ms
jquery.json.min.js
1681 ms
gravityforms.min.js
1483 ms
utils.min.js
1417 ms
vendor-theme.min.js
1471 ms
scripts-theme.min.js
1447 ms
webpack-pro.runtime.min.js
1447 ms
webpack.runtime.min.js
1271 ms
frontend-modules.min.js
1275 ms
frontend.min.js
1401 ms
waypoints.min.js
1461 ms
core.min.js
1270 ms
frontend.min.js
1269 ms
elements-handlers.min.js
1261 ms
viability-logo.svg
1041 ms
white-gradient-side.svg
1143 ms
Mia-Margarita-Logo.png
1203 ms
Cleland-Logo.png
1118 ms
Barking-Gecko-Logo.png
1121 ms
Cheffy-Chelby-Logo.png
1324 ms
SA-DEW-Logo.png
1127 ms
iJWZBXyIfDnIV5PNhY1KTN7Z-Yh-B4iFV0Uz.woff
69 ms
iJWZBXyIfDnIV5PNhY1KTN7Z-Yh-NYiFV0Uz.woff
70 ms
iJWZBXyIfDnIV5PNhY1KTN7Z-Yh-WYiFV0Uz.woff
105 ms
iJWZBXyIfDnIV5PNhY1KTN7Z-Yh-2Y-FV0Uz.woff
126 ms
iJWZBXyIfDnIV5PNhY1KTN7Z-Yh-4I-FV0Uz.woff
127 ms
iJWZBXyIfDnIV5PNhY1KTN7Z-Yh-h4-FV0Uz.woff
127 ms
iJWZBXyIfDnIV5PNhY1KTN7Z-Yh-ro-FV0Uz.woff
125 ms
Luigi-Logo.png
1255 ms
Cotto-Logo.png
1248 ms
White-Picket-Logo.png
1212 ms
Pizza-Mecc-Logo.png
1197 ms
CI-Logo.png
1204 ms
Kicco-Logo.jpg
1331 ms
revenue-ft-img.png
1275 ms
revenue-ipad.png
1602 ms
fixed-cost-ft-img.png
1202 ms
benchmarking-ipad.png
1405 ms
rostering-ft-img.webp
1210 ms
rostering-phone.png
1337 ms
ordering-ft-img.webp
1274 ms
ordering-phone.png
1218 ms
fixed-cost-ft-image.webp
1225 ms
fixedcost-ipad.png
1350 ms
EBITDA-ft-img.webp
1412 ms
EBITDA-phone.png
1413 ms
icon-01.svg
1280 ms
icon-02.svg
1227 ms
icon-03.svg
1351 ms
icon-04.svg
1412 ms
icon-05.svg
1412 ms
icon-06.svg
1408 ms
right-arrow-icon-white.svg
1278 ms
home-img-01.jpg
1427 ms
home-img-02.jpg
1350 ms
home-img-03.jpg
1411 ms
info.svg
1376 ms
border-linear.svg
1377 ms
blue-check-icon.svg
1278 ms
white-check-icon.svg
1350 ms
logo-gradient-box-bg-white.svg
1412 ms
lightspeed-logo.jpg
1410 ms
xero-logo.jpg
1405 ms
myob-logo.jpg
1279 ms
square.jpg
1225 ms
doshii-logo.jpg
1348 ms
swift-pos-logo.jpg
1409 ms
abacus.jpg
1410 ms
Vend-Logo.png
1405 ms
home-img-01-1.jpg
1481 ms
white-picket-coffee-house-sq-logo.jpg
1225 ms
quote-right-icon.svg
1346 ms
luigi-sq-logo.jpg
1401 ms
pizza-meccanica-sq-logo.jpg
1275 ms
cotto-sq-logo.jpg
1215 ms
cheffy-chelbys-sq-logo.jpg
1223 ms
CI-sq-logo.jpg
1345 ms
home-post-grid-ft-img.svg
1401 ms
dynamic-breakeven-point-ft-img.jpg
1275 ms
revenue-forecasts-ft-img.jpg
1217 ms
blue-radial-gradient-bg-footer.svg
1220 ms
green-radial-gradient-bg-footer.svg
1225 ms
viability.io accessibility score
viability.io best practices score
Trust and Safety
Impact
Issue
Does not use HTTPS
Ensure CSP is effective against XSS attacks
General
Impact
Issue
Detected JavaScript libraries
Page has valid source maps
viability.io SEO score
Mobile Friendly
Make sure your pages are mobile friendly so users don’t have to pinch or zoom in order to read the content pages. [Learn more](https://developers.google.com/search/mobile-sites/).
Impact
Issue
Document uses legible font sizes
EN
EN
UTF-8
Language claimed in HTML meta tag should match the language actually used on the web page. Otherwise Viability.io can be misinterpreted by Google and other search engines. Our service has detected that English is used on the page, and it matches the claimed language. Our system also found out that Viability.io main page’s claimed encoding is utf-8. Use of this encoding format is the best practice as the main page visitors from all over the world won’t have any issues with symbol transcription.
viability.io
Open Graph data is detected on the main page of Viability. This is the best way to make the web page social media friendly. Here is how it looks like on Facebook: