3.1 sec in total
389 ms
2.1 sec
648 ms
Visit goreport.com now to see the best up-to-date Go Report content for United Kingdom and also check out these interesting facts you probably never knew about goreport.com
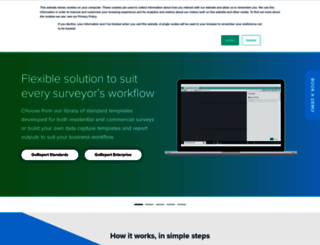
Deliver Greater Efficiency and Productivity with GoReport. Seamlessly capture and produce quality reports while reducing survey production time by at least 50%.
Visit goreport.comWe analyzed Goreport.com page load time and found that the first response time was 389 ms and then it took 2.7 sec to load all DOM resources and completely render a web page. This is a poor result, as 50% of websites can load faster.
goreport.com performance score
name
value
score
weighting
Value3.0 s
48/100
10%
Value4.3 s
43/100
25%
Value6.8 s
35/100
10%
Value2,350 ms
5/100
30%
Value0.218
57/100
15%
Value17.7 s
4/100
10%
389 ms
66 ms
31 ms
59 ms
160 ms
Our browser made a total of 95 requests to load all elements on the main page. We found that 84% of them (80 requests) were addressed to the original Goreport.com, 3% (3 requests) were made to Cookie-cdn.cookiepro.com and 1% (1 request) were made to Js.hs-scripts.com. The less responsive or slowest element that took the longest time to load (652 ms) belongs to the original domain Goreport.com.
Page size can be reduced by 164.7 kB (5%)
3.5 MB
3.3 MB
In fact, the total size of Goreport.com main page is 3.5 MB. This result falls beyond the top 1M of websites and identifies a large and not optimized web page that may take ages to load. 55% of websites need less resources to load. Images take 2.8 MB which makes up the majority of the site volume.
Potential reduce by 155.2 kB
HTML content can be minified and compressed by a website’s server. The most efficient way is to compress content using GZIP which reduces data amount travelling through the network between server and browser. This page needs HTML code to be minified as it can gain 63.7 kB, which is 36% of the original size. It is highly recommended that content of this web page should be compressed using GZIP, as it can save up to 155.2 kB or 88% of the original size.
Potential reduce by 665 B
Image size optimization can help to speed up a website loading time. The chart above shows the difference between the size before and after optimization. Go Report images are well optimized though.
Potential reduce by 8.6 kB
It’s better to minify JavaScript in order to improve website performance. The diagram shows the current total size of all JavaScript files against the prospective JavaScript size after its minification and compression. This website has mostly compressed JavaScripts.
Potential reduce by 293 B
CSS files minification is very important to reduce a web page rendering time. The faster CSS files can load, the earlier a page can be rendered. Goreport.com has all CSS files already compressed.
Number of requests can be reduced by 43 (48%)
89
46
The browser has sent 89 CSS, Javascripts, AJAX and image requests in order to completely render the main page of Go Report. We recommend that multiple CSS and JavaScript files should be merged into one by each type, as it can help reduce assets requests from 23 to 1 for JavaScripts and as a result speed up the page load time.
goreport.com
389 ms
otSDKStub.js
66 ms
jquery.min.js
31 ms
jquery-migrate.min.js
59 ms
SmoothScroll.min.js
160 ms
custom.js
195 ms
6961657.js
134 ms
primary-navigation.js
79 ms
responsive-embeds.js
44 ms
js.js
49 ms
api.js
57 ms
v2.js
56 ms
lazyload.min.js
77 ms
018ef096-d1e7-7203-96b2-c2f0974ec6b4.json
47 ms
location
43 ms
otBannerSdk.js
23 ms
gtm.js
130 ms
6961657.js
198 ms
6961657.js
152 ms
fb.js
125 ms
conversations-embed.js
124 ms
collectedforms.js
186 ms
web-interactives-embed.js
167 ms
polyfills.js
173 ms
search-grey.svg
62 ms
hero_shape_transparent.png
166 ms
hero_shape_top.png
121 ms
hero_shape_bottom.png
157 ms
03ee7d1be3923d41b9f4c8ee6fe2802f.css
65 ms
Lexend-Regular.woff
409 ms
Lexend-SemiBold.woff
185 ms
Lexend-Medium.woff
209 ms
Lexend-Bold.woff
230 ms
right-shape.png
253 ms
plus-sign.svg
286 ms
blue-shape.svg
277 ms
goreport_ul_icon.svg
213 ms
Lexend-Light.woff
324 ms
recaptcha__en.js
27 ms
Go-Report-Logo.svg
131 ms
Residencical.svg
147 ms
Residencical-hover.svg
164 ms
Commecial.svg
173 ms
Commecial-hover.svg
219 ms
Residential-Commercial-Surveyor.svg
193 ms
Residential-Commercial-Surveyor-hover.svg
207 ms
05-5.jpg
210 ms
blank_896_835.png
255 ms
Savills_logo.jpg
244 ms
summers-inman-logo-3.jpg
278 ms
Hollis-1.png
282 ms
JLL-1.png
265 ms
Novello-Logo-1.jpg
262 ms
AECOM-Logo.png
294 ms
approjects-logo-1-2.png
378 ms
FaithfulGould-new-logo.png
314 ms
hardies-retina-logo-1.png
297 ms
Go-Report_Device-Set_Mockup.png
337 ms
settings_FILL0_wght400_GRAD0_opsz24.svg
305 ms
check_circle_FILL0_wght400_GRAD0_opsz24-1.svg
315 ms
apps_FILL0_wght400_GRAD0_opsz24.svg
339 ms
AdobeStock_612774972-2.jpg
320 ms
blank_896_735.png
350 ms
05-4-1.jpg
425 ms
08-4.jpg
489 ms
04-5-2.jpg
468 ms
01-5.jpg
451 ms
Prepare.svg
280 ms
Prepare-hover.svg
275 ms
Survey.svg
274 ms
Survey-hover.svg
274 ms
Edit-Review.svg
267 ms
Edit-Review-hover.svg
280 ms
Publish.svg
268 ms
Publish-hover.svg
267 ms
Analyse.svg
277 ms
Analyse-hover.svg
282 ms
0.11-1-1-2-scaled.jpg
271 ms
Image_With_Content_Editor_And_Bullet_List_Image_Overlay_Shape_1.png
277 ms
Image_With_Content_Editor_And_Bullet_List_Image_Overlay_Shape_11.png
330 ms
manage_search_FILL0_wght400_GRAD0_opsz24-1.svg
269 ms
Implementation-team.svg
264 ms
Evolution-and-partnership-with-you.svg
262 ms
Customer-care.svg
250 ms
Frame-1000001883.svg
258 ms
support_FILL0_wght400_GRAD0_opsz24-1.svg
256 ms
beautiful-shot-of-city-buildings-in-the-distance-u-2023-11-27-05-13-42-utc-1.jpg
652 ms
mobile-cta.jpg
397 ms
blank_1180_460.png
337 ms
blank_362_219.png
251 ms
image92.png
244 ms
ISO-27001-logo-e1713359472115.jpg
263 ms
RICS_Tech_Partner_Logo_2022_16-9-1-1.jpg
290 ms
3769890aa5360e6983e6d8f2cd760dc1.png
264 ms
print.css
117 ms
goreport.com accessibility score
ARIA
These are opportunities to improve the usage of ARIA in your application which may enhance the experience for users of assistive technology, like a screen reader.
Impact
Issue
ARIA IDs are not unique
goreport.com best practices score
Trust and Safety
Impact
Issue
Does not use HTTPS
Ensure CSP is effective against XSS attacks
General
Impact
Issue
Detected JavaScript libraries
Page has valid source maps
goreport.com SEO score
Crawling and Indexing
To appear in search results, crawlers need access to your app.
Impact
Issue
Links are not crawlable
Mobile Friendly
Make sure your pages are mobile friendly so users don’t have to pinch or zoom in order to read the content pages. [Learn more](https://developers.google.com/search/mobile-sites/).
Impact
Issue
Document uses legible font sizes
EN
EN
UTF-8
Language claimed in HTML meta tag should match the language actually used on the web page. Otherwise Goreport.com can be misinterpreted by Google and other search engines. Our service has detected that English is used on the page, and it matches the claimed language. Our system also found out that Goreport.com main page’s claimed encoding is utf-8. Use of this encoding format is the best practice as the main page visitors from all over the world won’t have any issues with symbol transcription.
goreport.com
Open Graph data is detected on the main page of Go Report. This is the best way to make the web page social media friendly. Here is how it looks like on Facebook: