6 sec in total
80 ms
1.9 sec
4 sec
Click here to check amazing Sales I content for United States. Otherwise, check out these important facts you probably never knew about sales-i.com
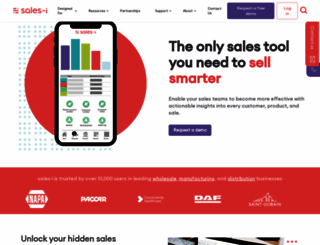
Our sales intelligence platform enables your sales teams to become more effective with actionable insights into every customer product & sale. Book a demo!
Visit sales-i.comWe analyzed Sales-i.com page load time and found that the first response time was 80 ms and then it took 5.9 sec to load all DOM resources and completely render a web page. This is a poor result, as 80% of websites can load faster.
sales-i.com performance score
name
value
score
weighting
Value3.4 s
36/100
10%
Value9.0 s
1/100
25%
Value8.6 s
17/100
10%
Value3,370 ms
2/100
30%
Value0.409
24/100
15%
Value25.6 s
0/100
10%
80 ms
105 ms
87 ms
148 ms
73 ms
Our browser made a total of 89 requests to load all elements on the main page. We found that 66% of them (59 requests) were addressed to the original Sales-i.com, 4% (4 requests) were made to Cdn2.hubspot.net and 3% (3 requests) were made to 7282726.fs1.hubspotusercontent-na1.net. The less responsive or slowest element that took the longest time to load (588 ms) relates to the external source Js.hs-banner.com.
Page size can be reduced by 433.6 kB (7%)
6.1 MB
5.6 MB
In fact, the total size of Sales-i.com main page is 6.1 MB. This result falls beyond the top 1M of websites and identifies a large and not optimized web page that may take ages to load. Only a small number of websites need less resources to load. Images take 5.7 MB which makes up the majority of the site volume.
Potential reduce by 214.6 kB
HTML content can be minified and compressed by a website’s server. The most efficient way is to compress content using GZIP which reduces data amount travelling through the network between server and browser. HTML code on this page is well minified. It is highly recommended that content of this web page should be compressed using GZIP, as it can save up to 214.6 kB or 85% of the original size.
Potential reduce by 213.8 kB
Image size optimization can help to speed up a website loading time. The chart above shows the difference between the size before and after optimization. Sales I images are well optimized though.
Potential reduce by 136 B
It’s better to minify JavaScript in order to improve website performance. The diagram shows the current total size of all JavaScript files against the prospective JavaScript size after its minification and compression. This website has mostly compressed JavaScripts.
Potential reduce by 5.0 kB
CSS files minification is very important to reduce a web page rendering time. The faster CSS files can load, the earlier a page can be rendered. Sales-i.com needs all CSS files to be minified and compressed as it can save up to 5.0 kB or 16% of the original size.
Number of requests can be reduced by 39 (46%)
84
45
The browser has sent 84 CSS, Javascripts, AJAX and image requests in order to completely render the main page of Sales I. We recommend that multiple CSS and JavaScript files should be merged into one by each type, as it can help reduce assets requests from 24 to 1 for JavaScripts and from 17 to 1 for CSS and as a result speed up the page load time.
www.sales-i.com
80 ms
sumoselect.min.css
105 ms
jquery.min.js
87 ms
adjusted-breadcrumb.min.js
148 ms
main.min.css
73 ms
css
118 ms
theme-overrides.min.css
171 ms
styles.min.css
255 ms
module_34673095772_Floating_Contact_Us_v3.css
215 ms
module_36836441504_Main_Navigation.min.css
118 ms
module_-2712622_Site_Search_Input.min.css
125 ms
slick.min.css
237 ms
module_54457718670_Logo_Carousel.min.css
266 ms
module_54363100763_BBS_Flipper_Image_1.min.css
371 ms
module_-35056501883_Video.min.css
138 ms
1styles-1598455456758.min.css
332 ms
module_34129151355_Dynamic_Content_Boxes.min.css
376 ms
module_33234940465_social-follow.min.css
254 ms
css
116 ms
launch-7cf9e45b2b44.min.js
78 ms
current.js
278 ms
main.js
267 ms
project.js
282 ms
module_34673095772_Floating_Contact_Us_v3.min.js
285 ms
v2.js
309 ms
module_36836441504_Main_Navigation.min.js
298 ms
module_-2712622_Site_Search_Input.min.js
134 ms
jquery-1.11.3.min.js
107 ms
slick.min.js
110 ms
module_-35056501883_Video.min.js
153 ms
loader.js
104 ms
1734343.js
315 ms
index.js
314 ms
gtm.js
177 ms
4670562b-2f8b-4215-b22a-88db46b86b02.png
174 ms
search-icon.png
41 ms
phone-1.svg
169 ms
sales-i_logo.svg
191 ms
fin.gif
181 ms
Unlock%20your%20hidden%20sales%20potential.png
174 ms
Sales%20Enablement%20(1).png
176 ms
Sales%20Analytics%20(1).png
177 ms
CRM%20(11).png
442 ms
Copy%20of%20Keep%20track%20of%20all%20your%20sales%20calls%20(4).png
183 ms
Copy%20of%20Keep%20track%20of%20all%20your%20sales%20calls%20(7).png
181 ms
Copy%20of%20Keep%20track%20of%20all%20your%20sales%20calls%20(6).png
184 ms
1-Jan-14-2022-09-36-10-36-AM.png
434 ms
ERP%20(3).png
182 ms
Mail%20Icon.svg
184 ms
82933c3f-19cb-46f6-bdb6-bc14b3dc230c.png
177 ms
1styles-1598455456758.min.css
390 ms
EuclidCircularA-Regular.woff
483 ms
EuclidCircularA-Medium.woff
483 ms
Blog%20Image%20Size%20%20%283%29.jpg
127 ms
Blog%20Image%20Size%20%20%284%29-1.jpg
361 ms
Blog%20Image%20Size%20%20%281%29.jpg
350 ms
json
138 ms
json
110 ms
ajax-loader.gif
161 ms
medium.jpg
423 ms
NAPA%20Logo.png
407 ms
Paccar%20(1).png
343 ms
Countrywide%20Healthcare.png
94 ms
DAF%20(2).png
405 ms
Saint%20Gobain%20(2).png
93 ms
NISBETS%20(1).png
340 ms
Kimbo%20Logo.png
339 ms
Global%20Brands%20Logo.png
341 ms
1-Jan-19-2022-08-28-24-30-AM.png
347 ms
GetApp.png
347 ms
Icons%20(4).png
346 ms
2-Jan-19-2022-08-28-24-30-AM.png
345 ms
4-4.png
417 ms
Capterra-2.png
417 ms
177169.js
545 ms
fbevents.js
379 ms
fb.js
522 ms
leadflows.js
536 ms
1734343.js
586 ms
1734343.js
588 ms
conversations-embed.js
534 ms
enterprise.js
564 ms
S6uyw4BMUTPHjx4wWw.ttf
303 ms
S6u9w4BMUTPHh6UVSwiPHA.ttf
304 ms
994822804264088
245 ms
DAF%20(2).png
89 ms
NAPA%20Logo.png
83 ms
4-4.png
70 ms
Capterra-2.png
69 ms
sales-i.com accessibility score
ARIA
These are opportunities to improve the usage of ARIA in your application which may enhance the experience for users of assistive technology, like a screen reader.
Impact
Issue
[aria-hidden="true"] elements contain focusable descendents
Contrast
These are opportunities to improve the legibility of your content.
Impact
Issue
Background and foreground colors do not have a sufficient contrast ratio.
Navigation
These are opportunities to improve keyboard navigation in your application.
Impact
Issue
Heading elements are not in a sequentially-descending order
sales-i.com best practices score
Trust and Safety
Impact
Issue
Does not use HTTPS
Includes front-end JavaScript libraries with known security vulnerabilities
Ensure CSP is effective against XSS attacks
User Experience
Impact
Issue
Serves images with low resolution
General
Impact
Issue
Detected JavaScript libraries
Browser errors were logged to the console
Page has valid source maps
sales-i.com SEO score
Crawling and Indexing
To appear in search results, crawlers need access to your app.
Impact
Issue
Links are not crawlable
Mobile Friendly
Make sure your pages are mobile friendly so users don’t have to pinch or zoom in order to read the content pages. [Learn more](https://developers.google.com/search/mobile-sites/).
Impact
Issue
Document uses legible font sizes
EN
EN
UTF-8
Language claimed in HTML meta tag should match the language actually used on the web page. Otherwise Sales-i.com can be misinterpreted by Google and other search engines. Our service has detected that English is used on the page, and it matches the claimed language. Our system also found out that Sales-i.com main page’s claimed encoding is utf-8. Use of this encoding format is the best practice as the main page visitors from all over the world won’t have any issues with symbol transcription.
sales-i.com
Open Graph data is detected on the main page of Sales I. This is the best way to make the web page social media friendly. Here is how it looks like on Facebook: