2.8 sec in total
189 ms
2.4 sec
137 ms
Click here to check amazing Stat Show content for India. Otherwise, check out these important facts you probably never knew about statshow.com
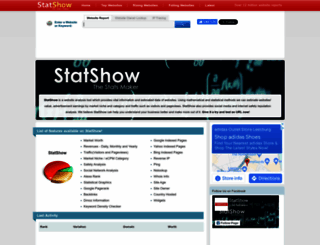
Statshow is a free website worth or value calculator and traffic estimator tool. Using our SEO tools you can answer questions like how much is my website worth or what's my website value? Just type th...
Visit statshow.comWe analyzed Statshow.com page load time and found that the first response time was 189 ms and then it took 2.6 sec to load all DOM resources and completely render a web page. This is a poor result, as 50% of websites can load faster.
statshow.com performance score
name
value
score
weighting
Value2.4 s
69/100
10%
Value3.1 s
76/100
25%
Value10.6 s
7/100
10%
Value5,820 ms
0/100
30%
Value0
100/100
15%
Value21.5 s
1/100
10%
189 ms
241 ms
23 ms
29 ms
46 ms
Our browser made a total of 98 requests to load all elements on the main page. We found that 29% of them (28 requests) were addressed to the original Statshow.com, 8% (8 requests) were made to Tpc.googlesyndication.com and 7% (7 requests) were made to Pagead2.googlesyndication.com. The less responsive or slowest element that took the longest time to load (523 ms) relates to the external source Googleads.g.doubleclick.net.
Page size can be reduced by 261.5 kB (28%)
943.4 kB
681.9 kB
In fact, the total size of Statshow.com main page is 943.4 kB. This result falls beyond the top 1M of websites and identifies a large and not optimized web page that may take ages to load. 60% of websites need less resources to load. Javascripts take 810.1 kB which makes up the majority of the site volume.
Potential reduce by 29.5 kB
HTML content can be minified and compressed by a website’s server. The most efficient way is to compress content using GZIP which reduces data amount travelling through the network between server and browser. HTML code on this page is well minified. It is highly recommended that content of this web page should be compressed using GZIP, as it can save up to 29.5 kB or 74% of the original size.
Potential reduce by 141 B
Image size optimization can help to speed up a website loading time. The chart above shows the difference between the size before and after optimization. Stat Show images are well optimized though.
Potential reduce by 230.1 kB
It’s better to minify JavaScript in order to improve website performance. The diagram shows the current total size of all JavaScript files against the prospective JavaScript size after its minification and compression. It is highly recommended that all JavaScript files should be compressed and minified as it can save up to 230.1 kB or 28% of the original size.
Potential reduce by 1.7 kB
CSS files minification is very important to reduce a web page rendering time. The faster CSS files can load, the earlier a page can be rendered. Statshow.com needs all CSS files to be minified and compressed as it can save up to 1.7 kB or 22% of the original size.
Number of requests can be reduced by 47 (55%)
86
39
The browser has sent 86 CSS, Javascripts, AJAX and image requests in order to completely render the main page of Stat Show. We recommend that multiple CSS and JavaScript files should be merged into one by each type, as it can help reduce assets requests from 33 to 1 for JavaScripts and as a result speed up the page load time.
statshow.com
189 ms
www.statshow.com
241 ms
style.min.css
23 ms
jquery.min.js
29 ms
main.min.js
46 ms
check_url.min.js
59 ms
jexpand.min.js
60 ms
adsbygoogle.js
208 ms
table.css
59 ms
js15.js
44 ms
counter.js
45 ms
like.php
125 ms
all.js
42 ms
gplus-16.png
41 ms
0.php
175 ms
analytics.js
46 ms
widgets.js
190 ms
restserver.php
74 ms
bg.jpg
29 ms
logo.png
28 ms
header_bottom_border_line.gif
28 ms
statman_head.gif
28 ms
search_bar.gif
70 ms
search_bar_ani.gif
71 ms
header_bottom_border.gif
71 ms
loading.gif
70 ms
presentation_big.jpg
75 ms
title_sub.png
73 ms
3d_chart.jpg
73 ms
menu_bullet.gif
73 ms
google_icon.png
73 ms
bing_icon.png
95 ms
bottom_back.jpg
96 ms
logo_bottom.png
96 ms
world_bottom.png
95 ms
dialog.gif
104 ms
social_facebook.png
103 ms
social_twitter.png
103 ms
ibm_logo.gif
104 ms
t.php
96 ms
all.js
41 ms
collect
98 ms
73 ms
9RkfBY4NJsx.js
99 ms
FEppCFCt76d.png
97 ms
show_ads_impl.js
294 ms
collect
52 ms
js
75 ms
229 ms
widget_iframe.2f70fb173b9000da126c79afe2098f02.html
120 ms
settings
70 ms
button.856debeac157d9669cf51e73a08fbc93.js
24 ms
207 ms
tag.min.js
26 ms
afwu.js
81 ms
400 ms
embeds
65 ms
follow_button.2f70fb173b9000da126c79afe2098f02.en.html
76 ms
zrt_lookup.html
40 ms
ads
523 ms
p
101 ms
ads
511 ms
ads
406 ms
lt.min.js
15 ms
v2
92 ms
41 ms
103 ms
generic
14 ms
generic
4 ms
8563292870751800453
5 ms
generic
3 ms
mapuid
43 ms
v2
41 ms
405716.gif
86 ms
reactive_library.js
361 ms
ca-pub-6072412641931604
268 ms
14763004658117789537
33 ms
load_preloaded_resource.js
31 ms
abg_lite.js
31 ms
s
19 ms
window_focus.js
27 ms
qs_click_protection.js
30 ms
ufs_web_display.js
53 ms
c653839755d9d9a3a773c62a0253f53f.js
203 ms
icon.png
18 ms
14423067356875392270
262 ms
css
100 ms
pixel
113 ms
activeview
235 ms
d4Vwwu8iHiCDxZ1xzxUGRbEaLZqCebWmAfX3l2eV90k.js
109 ms
4Ua_rENHsxJlGDuGo1OIlJfC6l_24rlCK1Yo_Iqcsih3SAyH6cAwhX9RFD48TE63OOYKtrwEIJllpyw.ttf
263 ms
4Ua_rENHsxJlGDuGo1OIlJfC6l_24rlCK1Yo_Iqcsih3SAyH6cAwhX9RFD48TE63OOYKtrw2IJllpyw.ttf
335 ms
activeview
318 ms
feedback_grey600_24dp.png
162 ms
fullscreen_api_adapter.js
103 ms
interstitial_ad_frame.js
102 ms
settings_grey600_24dp.png
157 ms
sync
110 ms
statshow.com accessibility score
Contrast
These are opportunities to improve the legibility of your content.
Impact
Issue
Background and foreground colors do not have a sufficient contrast ratio.
Names and labels
These are opportunities to improve the semantics of the controls in your application. This may enhance the experience for users of assistive technology, like a screen reader.
Impact
Issue
<frame> or <iframe> elements do not have a title
Image elements do not have [alt] attributes
Form elements do not have associated labels
Links do not have a discernible name
statshow.com best practices score
Trust and Safety
Impact
Issue
Does not use HTTPS
Includes front-end JavaScript libraries with known security vulnerabilities
Ensure CSP is effective against XSS attacks
User Experience
Impact
Issue
Serves images with low resolution
General
Impact
Issue
Detected JavaScript libraries
Browser errors were logged to the console
Page has valid source maps
statshow.com SEO score
Content Best Practices
Format your HTML in a way that enables crawlers to better understand your app’s content.
Impact
Issue
Image elements do not have [alt] attributes
EN
EN
UTF-8
Language claimed in HTML meta tag should match the language actually used on the web page. Otherwise Statshow.com can be misinterpreted by Google and other search engines. Our service has detected that English is used on the page, and it matches the claimed language. Our system also found out that Statshow.com main page’s claimed encoding is utf-8. Use of this encoding format is the best practice as the main page visitors from all over the world won’t have any issues with symbol transcription.
statshow.com
Open Graph description is not detected on the main page of Stat Show. Lack of Open Graph description can be counter-productive for their social media presence, as such a description allows converting a website homepage (or other pages) into good-looking, rich and well-structured posts, when it is being shared on Facebook and other social media. For example, adding the following code snippet into HTML <head> tag will help to represent this web page correctly in social networks: