Report Summary

  • 75

    Performance

    Renders faster than
    84% of other websites

  • 98

    Accessibility

    Visual factors better than
    that of 94% of websites

  • 92

    Best Practices

    More advanced features
    available than in
    81% of websites

  • 91

    SEO

    Google-friendlier than
    71% of websites

vistable.com

visTABLE® Software - Simplifying your approach to digital factory

Page Load Speed

2.5 sec in total

First Response

318 ms

Resources Loaded

1.2 sec

Page Rendered

952 ms

vistable.com screenshot

About Website

Welcome to vistable.com homepage info - get ready to check VisTABLE best content right away, or after learning these important things about vistable.com

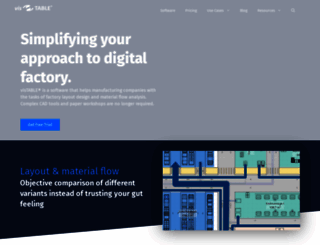
The easiest software that helps manufacturing companies with thier tasks of digital factory layout design and material flow analysis.

Visit vistable.com

Key Findings

We analyzed Vistable.com page load time and found that the first response time was 318 ms and then it took 2.2 sec to load all DOM resources and completely render a web page. This is quite a good result, as only 40% of websites can load faster.

Performance Metrics

vistable.com performance score

75

Measured Metrics

name

value

score

weighting

FCP (First Contentful Paint)

Value2.3 s

76/100

10%

LCP (Largest Contentful Paint)

Value3.2 s

73/100

25%

SI (Speed Index)

Value4.2 s

78/100

10%

TBT (Total Blocking Time)

Value390 ms

69/100

30%

CLS (Cumulative Layout Shift)

Value0

100/100

15%

TTI (Time to Interactive)

Value6.7 s

56/100

10%

Network Requests Diagram

vistable.com

318 ms

www.vistable.com

262 ms

jquery.min.js

25 ms

sticky.min.js

178 ms

offside.min.js

209 ms

Our browser made a total of 41 requests to load all elements on the main page. We found that 93% of them (38 requests) were addressed to the original Vistable.com, 2% (1 request) were made to Js.usemessages.com and 2% (1 request) were made to Js.hs-analytics.net. The less responsive or slowest element that took the longest time to load (406 ms) belongs to the original domain Vistable.com.

Page Optimization Overview & Recommendations

Page size can be reduced by 219.1 kB (37%)

Content Size

585.4 kB

After Optimization

366.3 kB

In fact, the total size of Vistable.com main page is 585.4 kB. This result falls beyond the top 1M of websites and identifies a large and not optimized web page that may take ages to load. 30% of websites need less resources to load. Images take 278.5 kB which makes up the majority of the site volume.

HTML Optimization

-82%

Potential reduce by 215.5 kB

  • Original 261.5 kB
  • After minification 257.6 kB
  • After compression 46.0 kB

HTML content can be minified and compressed by a website’s server. The most efficient way is to compress content using GZIP which reduces data amount travelling through the network between server and browser. HTML code on this page is well minified. It is highly recommended that content of this web page should be compressed using GZIP, as it can save up to 215.5 kB or 82% of the original size.

Image Optimization

-0%

Potential reduce by 0 B

  • Original 278.5 kB
  • After minification 278.5 kB

Image size optimization can help to speed up a website loading time. The chart above shows the difference between the size before and after optimization. VisTABLE images are well optimized though.

JavaScript Optimization

-8%

Potential reduce by 3.6 kB

  • Original 45.4 kB
  • After minification 45.4 kB
  • After compression 41.8 kB

It’s better to minify JavaScript in order to improve website performance. The diagram shows the current total size of all JavaScript files against the prospective JavaScript size after its minification and compression. This website has mostly compressed JavaScripts.

Requests Breakdown

Number of requests can be reduced by 26 (67%)

Requests Now

39

After Optimization

13

The browser has sent 39 CSS, Javascripts, AJAX and image requests in order to completely render the main page of VisTABLE. We recommend that multiple CSS and JavaScript files should be merged into one by each type, as it can help reduce assets requests from 27 to 1 for JavaScripts and as a result speed up the page load time.

Accessibility Review

vistable.com accessibility score

98

Accessibility Issues

Contrast

These are opportunities to improve the legibility of your content.

Impact

Issue

High

Background and foreground colors do not have a sufficient contrast ratio.

Best Practices

vistable.com best practices score

92

Areas of Improvement

Trust and Safety

Impact

Issue

High

Does not use HTTPS

Low

Ensure CSP is effective against XSS attacks

General

Impact

Issue

Low

Detected JavaScript libraries

High

Page has valid source maps

SEO Factors

vistable.com SEO score

91

Search Engine Optimization Advices

Crawling and Indexing

To appear in search results, crawlers need access to your app.

Impact

Issue

High

Links are not crawlable

Mobile Friendly

Make sure your pages are mobile friendly so users don’t have to pinch or zoom in order to read the content pages. [Learn more](https://developers.google.com/search/mobile-sites/).

Impact

Issue

High

Document uses legible font sizes

High

Tap targets are not sized appropriately

Language and Encoding

  • Language Detected

    EN

  • Language Claimed

    EN

  • Encoding

    UTF-8

Language claimed in HTML meta tag should match the language actually used on the web page. Otherwise Vistable.com can be misinterpreted by Google and other search engines. Our service has detected that English is used on the page, and it matches the claimed language. Our system also found out that Vistable.com main page’s claimed encoding is utf-8. Use of this encoding format is the best practice as the main page visitors from all over the world won’t have any issues with symbol transcription.

Social Sharing Optimization

Open Graph data is detected on the main page of VisTABLE. This is the best way to make the web page social media friendly. Here is how it looks like on Facebook: